Announcing the WPdx Monitoring, Evaluation, Adapting and Learning (MEAL) Guide
The WPdx Data Standard was created in 2015 by an expert working group and defines a set of basic parameters that should be collected when
Beta version 1.0 released March 2022
The Administrative Region Analysis Tool provides an overview of the population served, unserved and uncharted for each available administrative level.
Users can view chloropleth maps, which provide administrative regional analysis for the percentage of Served, Unserved and Uncharted populations by selecting an option from the ‘Parameter of Interest’ dropdown menu on the header bar and by selecting their preferred administrative zone (Adm0, Adm1, Adm2, Adm3, Adm4) from the top navigation bar. Please note that different countries have varying numbers of administrative divisions.
For each administrative division, the population is determined using the Facebook High Resolution Population Data and administrative boundaries from GADM or HDX (Eswatini, Ghana and Uganda). The population from urban areas, based on the definitions provided by EU Global Human Settlement Database is then removed, leaving an estimate of the total rural population for that administrative region.
Using data from WPdx+, the total population within a 1km radius of functional water points is identified (local_access_pop). The local_access_pop is removed from the population raster, and then the total population within a 1km radius of non–functional water points is determined (local_no_access_pop). Next, the amount of population assigned to functional water points who exceed the maximum capacity of those water points is determined (overcap_pop). The overcap_pop is subtracted from the local_access_pop to find the estimated Rural Population with Basic Access. The overcap_pop is added to the local_no_access_pop to find the estimated Rural Population without Basic Access. The remaining population which are more than 1km from an existing water point are designated as the Uncharted Rural Population. Uncharted could mean that populations in these areas lack basic access or that there is not data in WPdx+ about the water services for populations in these areas.
This analysis is based on the latest available data from the WPdx+ dataset, population estimates from the Facebook High Resolution Population Datasets and administrative boundaries from GADM or HDX (Eswatini, Ghana and Uganda).
WPdx is an open-source repository for data and contributors include governments, NGOs, academic researchers, and others. WPdx has not directly collected this data or verified the accuracy of the data on the platform. WPdx does perform basic validation checks to ensure that required parameters are included and that GPS locations match with the country boundaries of the provided datasets. Additional cleaning and categorizing steps are taken to prepare the dataset for analysis. Full details of these processes can be found on our website. Questions and feedback are more than welcome.
Populations in urban areas, as defined by the EU Global Human Settlement Database are removed from the total administrative region population to provide an estimate of the rural population. While included on the maps for visualization purposes, packaged and delivered water facilities are not included in the analyses to determine served and unserved populations.
Any water points that have been broken, rehabilitated, or constructed since data was uploaded are not included in this analysis. Additionally, household connections are not captured in WPdx. While large urban areas are removed from the analysis if they reach a specified population density, smaller piped schemes with household connections may be missed. As a result, peri-urban areas may be identified as optimal locations for rehabilitation or new construction, even if those communities are already served by household connections.Additionally, because urban populations are based on population density, there may be areas that are locally considered urban which are considered rural in this analysis, or inversely rural areas that are considered urban for this analysis.
The WPdx Data Standard was created in 2015 by an expert working group and defines a set of basic parameters that should be collected when
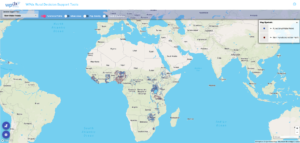
We are excited to share two new resources exploring applications of the WPdx Decision Support Tools app: A detailed written tutorial with pictures describing how
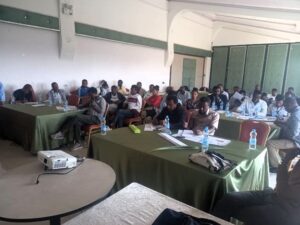
Photo caption: WPdx training delivered by MWA to government stakeholder and Sustainable WASH Program implementation partners in March 2023. Photo credit: Selamawit Tiruneh Over the