

In an ongoing effort to support improved rural water access investment decision-making, WPdx announces the launch of its updated Rehabilitation Priority Tool which enables users to immediately identify specific water points for prioritized rehabilitation or repair based on population.
The input for this updated analytical tool is the new WPdx+ dataset, a further enhanced and refined version of the original WPdx dataset (WPdx-Basic) which includes additional data cleaning and processing steps for more robust analysis.
Rehabilitation Priority Tool Overview:
- A series of geospatial population-based analyses to prioritize water points based on potential impact.
- Additional parameters to consider when prioritizing areas for rehabilitation, including:
- Population within 1km – Total population within 1km of the water point
- Users who would gain access – Estimated number of people who would gain access if a currently non-functional water point was rehabilitated. Population assigned to water point considers the existence of functional water points within a 1km radius. Populations are assigned based on relative distance between each population grid cell and the water points.
- Likely current users – Estimated number of people who could be currently using a working water point. Population assigned to water point considers the existence of functional water points within a 1km radius. Populations are assigned based on relative distance between each population grid cell and the water points.
- Crucialness score (0-100%) is the ratio of potential users to the total local population within a 1km radius of the water point. Crucialness provides a measure of water system redundancy. For example, if there is only 1 water point within a 1km radius, the water point crucialness score is 100%, meaning that there are no nearby alternatives. If there are two functional water points within 1km, the crucialness score for each point will be ~50% indicating there is some redundancy in the system, so if one water point is broken down, users have an alternative water point available. For non-functional water points, the crucialness score shows how important the water point would be if it were to be rehabilitated. See example here.
- Pressure score (0-100%) is calculated based on the ratio of the number of people assigned to that water point over the theoretical maximum population which can be served based on the technology. If a point is serving less than the recommended maximum, the pressure score will be less than 100% (i.e., 250/500 = 0.5). If a point is serving more than the recommended maximum, the pressure score will be over 100% (i.e., 750/500 = 150%). The following recommended maximum values (extended from Sphere Guidelines) are currently in use:
- 250 people per tap [tapstand, kiosk, rainwater catchment]
- 500 people per hand pump [all hand pumps]
- 400 people per open hand well [rope and bucket]
- 1,000 people per mechanized well
Quick peak:
6 key tool features and options:
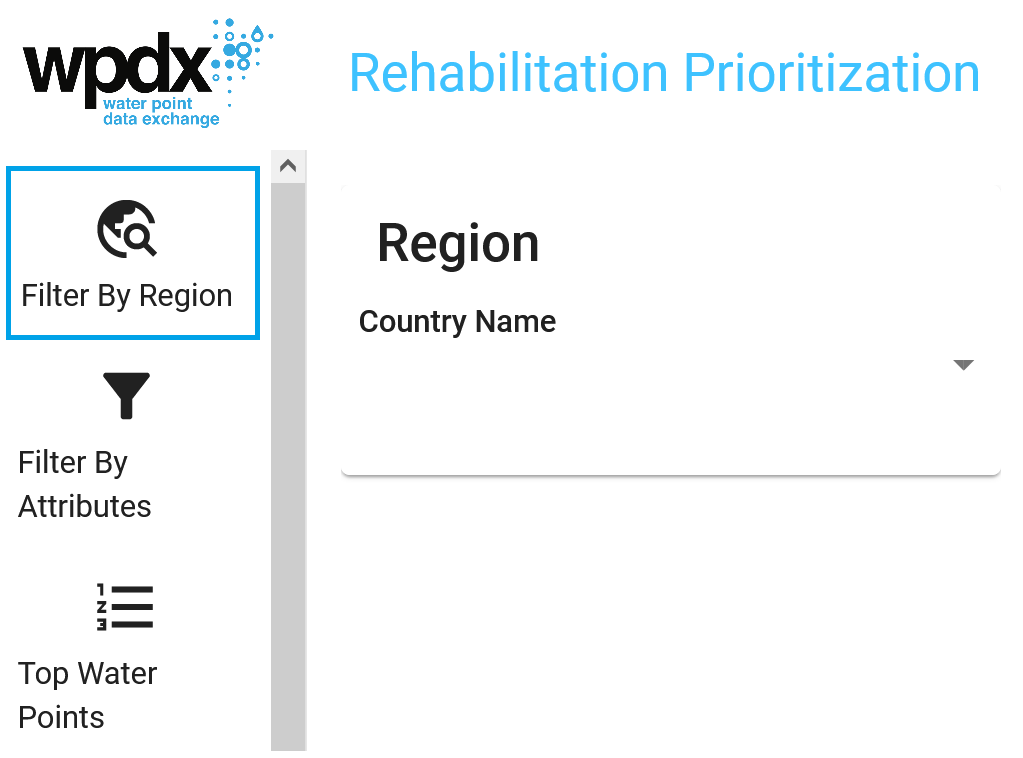
1. Users can filter based on country and administrative division name down to the administrative division 3 (adm3) level.
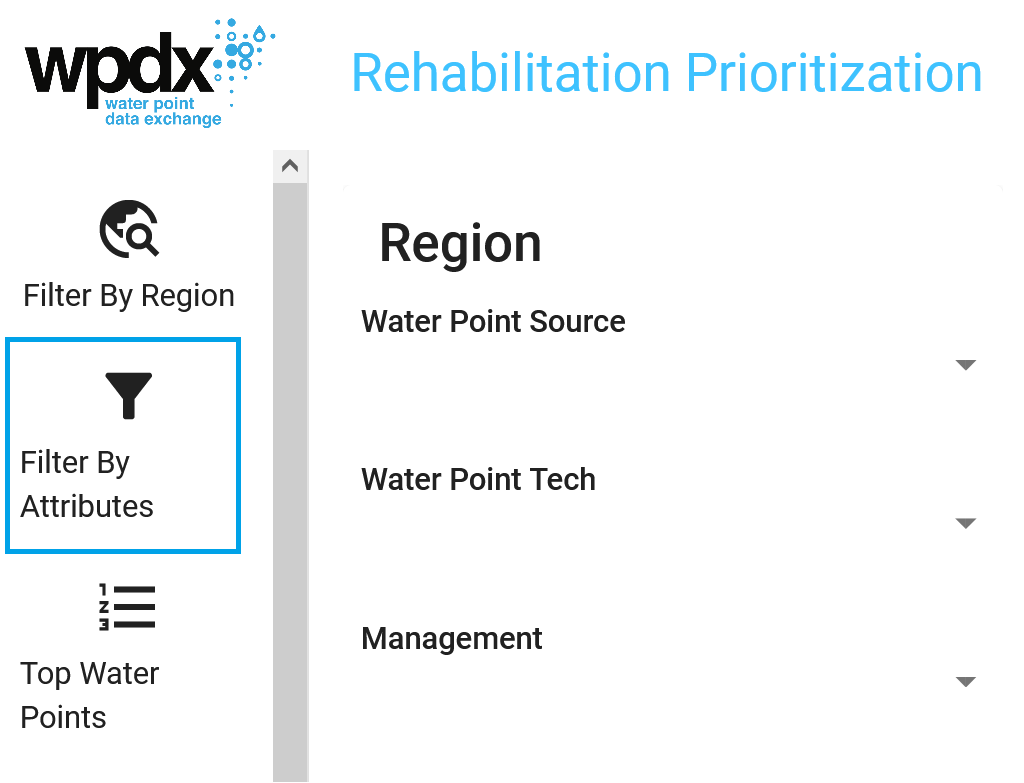
2. Users can filter water points by source (borehole, shallow well, spring, etc.), technology (handpump, mechanized pump, etc.) and management (community management, direct government operations, etc.)
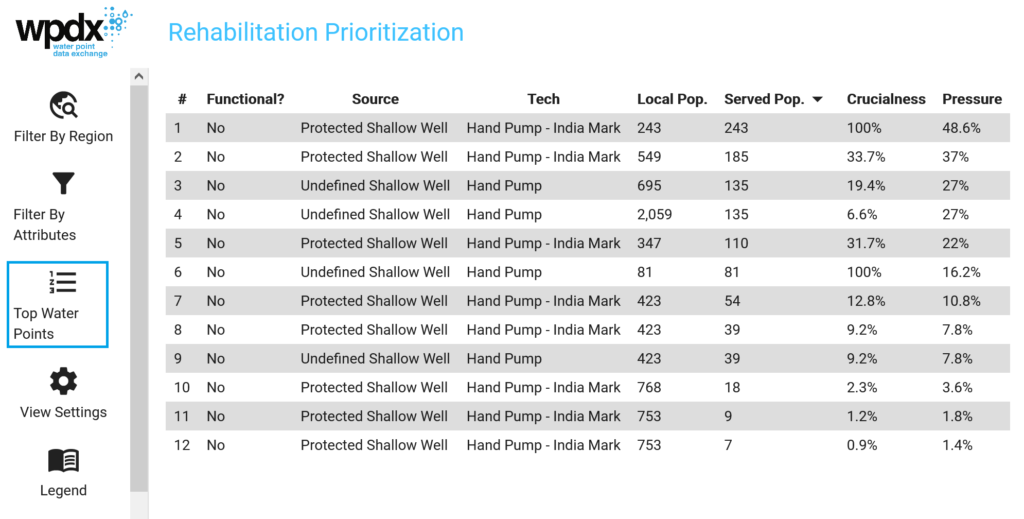
3. The Top Water Points table shows the top 15 water points which would be recommended for priority consideration.
- The default setting will show priority based on number of ‘Served Pop.’
- For working water points, ‘Served Pop.’ represents ‘Likely Current Users’ and for non-functional points, ‘Served Pop.’ represents ‘Potential users who could regain access’.
- Users can also click on ‘Population within 1km’, ‘Crucialness’ or ‘Pressure’ and the table will be updated to show the priority for each of these parameters.
- Users can select to show/hide functional points and points in urban areas, and the table will update to reflect these choices.
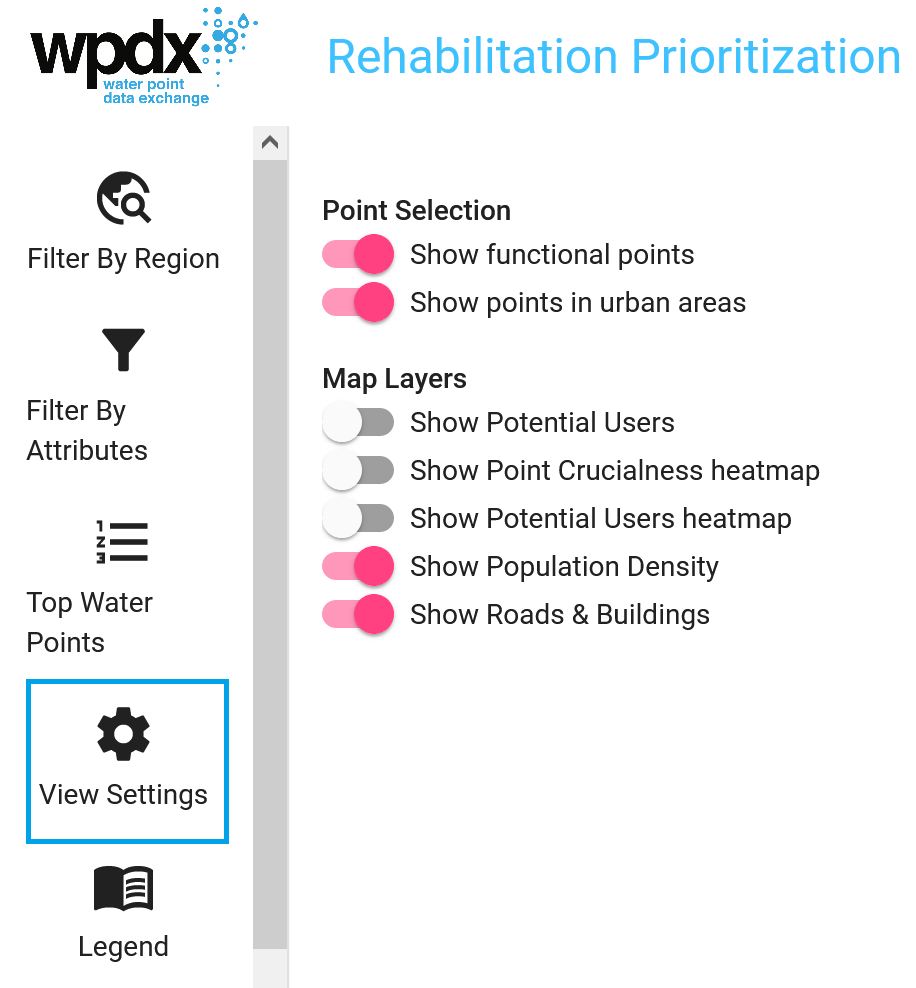
4. Users can select options to show/hide different layers, including functional points, population data and roads/buildings. Key options available in top selection bar, with additional options in Settings.
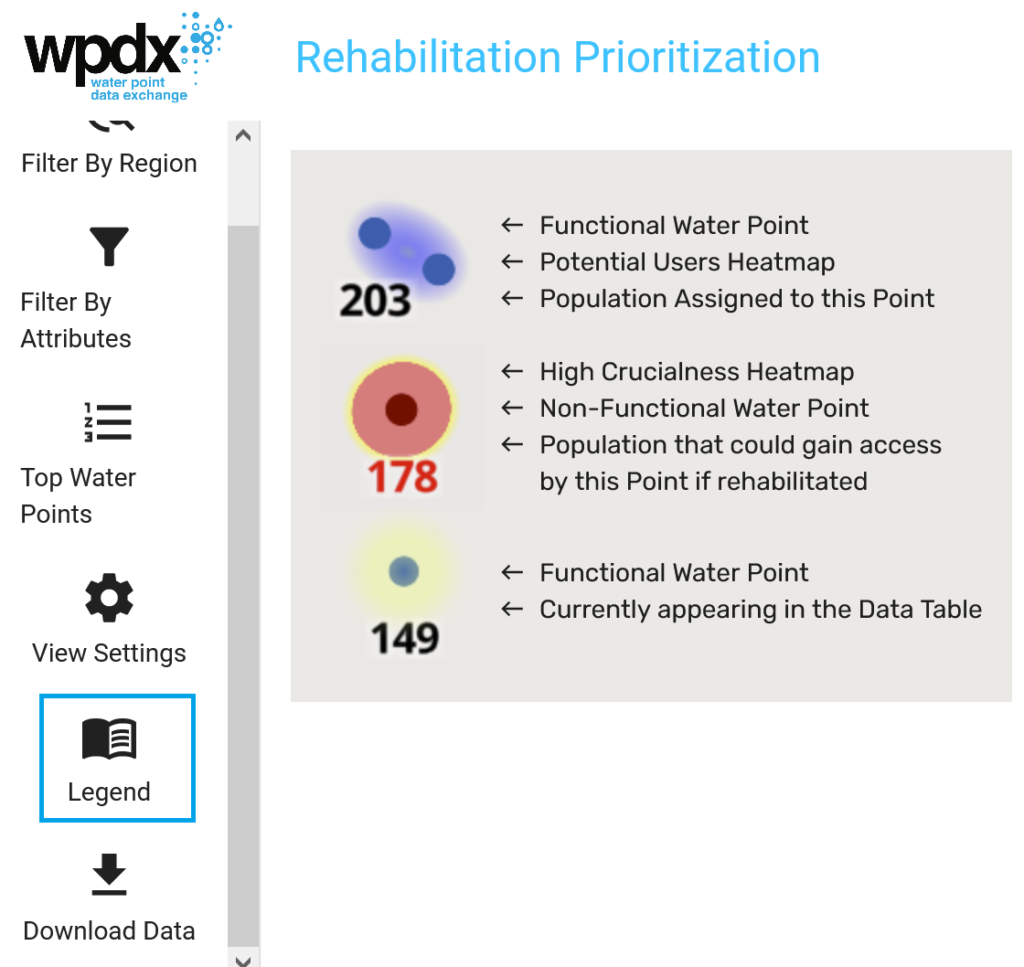
5. The Legend describes the different visualizations possible through various Settings selections.
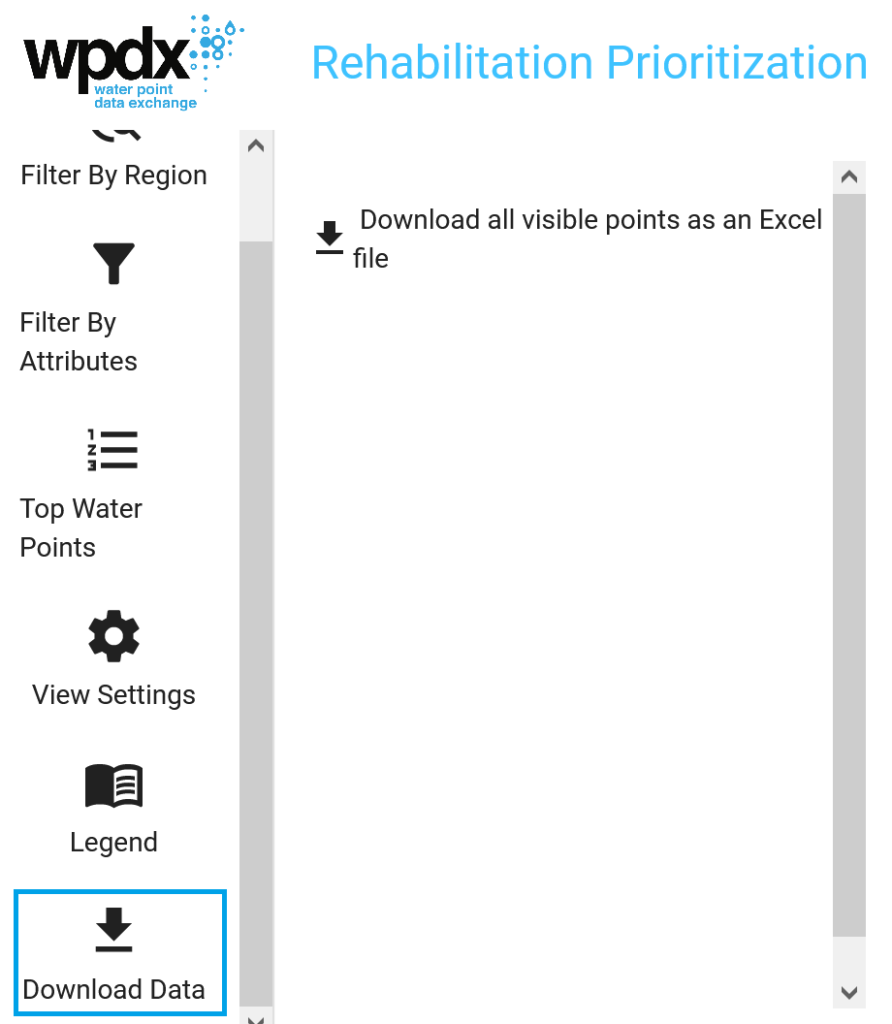
6. Users can download the full table of results by selecting ‘Download Data’.
- If you have filtered to a specific location, all data in that administrative area will be included in the download.
- If you have zoomed in to a sub-area of interest, the download will include all visible data or all filtered data.
Please feel free to ask questions and provide feedback on the new tool.