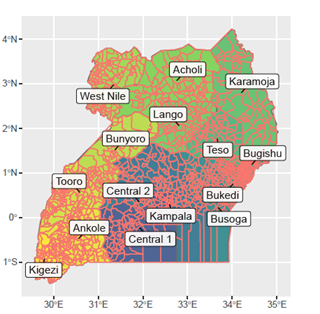
Figure shows how DHS regions in Uganda (labeled) compared to WPdx regions (sub-counties from GADM) in red
What data should I use? Is the data valid? These are some of the driving questions facing decision makers around the world. Multiple sources of data are available to decision makers on the state of water access and services. There is relatively strong agreement that reliable data for decision making is needed. At the same time, it is not always clear which data sources are both available and appropriate to answer the questions about where and how to invest resources in water services and how to appropriately target the poorest.
With funding from the United States Agency for International Development (USAID) Governance Research on Water Systems (GROWS) activity, a study was commissioned to determine how water point coverage estimates based on publicly available data from the Water Point Data Exchange (WPdx) compare and contrast with the official Joint Monitoring Programme of WHO/UNICEF (JMP) figures. The goal is to provide recommendations about how these different estimates could be used in tandem and to identify their respective strengths and limitations. The study was carried out by Nick Dickinson of WASHNote.
Comparing between metrics and triangulating different measured results can be useful to validate conclusions and inform decision-making. This study finds a relatively strong correlation and linear trend between these two estimates in four countries that suggests that using household surveys and water point inventories together can be useful to decision makers who may only have one or the other data sources or may want to validate the conclusions from one against another.
The full paper has been submitted for peer review. A pre-print is available here. A link to the final paper will be added here once the paper has been accepted.
Acknowledgements from the Author, Nick Dickinson of WASHNote
This study would not have been possible without the contribution of open data on water points by data providers to WPdx. Members of the Water Point Data Exchange (WPdx) working group reviewed both the proposal and findings of this work. Katy Sill of WPdx first recognized the potential of the work, provided invaluable feedback, and responded quickly with explanations about how the WPdx algorithms work while investigating and delivering improvements to the tools when required to make this comparison possible.
Similarly, the National Statistics Offices (NSOs) and the Demographic and Health Surveys (DHS) Program of the United States Agency for International Development (USAID) made it possible to use household survey data from different countries. I would like to thank the Joint Monitoring Programme of WHO/UNICEF (JMP) team for sharing country, regional and global estimates of progress on drinking water, sanitation and hygiene (WASH) in households as well as the estimates for the sub-indicators required to generate those estimates, for providing clarifications about the JMP methodology, and for taking time to reflect on study findings.
This material is based upon work supported by USAID under award number 7200AA18CA00033.
