
Challenges in Water Point Sustainability
The lack of sustainability of rural water points sources is a persistent problem in sub-Saharan Africa. At any one time, an estimated 25% of hand pumps are non-functional (Foster et al., 2019) with many failures occurring within the first 1-2 years (Danert, 2022). These premature and widespread failures are in spite of the fact that water point components have designed lifetimes of 10-15 years (hand pumps) and over 25 years (wells and boreholes). There are a multitude of factors which contribute to water point failure including limited access to spare parts, funding for maintenance, availability of a qualified mechanic, seasonality, community capacity for management, construction quality, and others (Danert, 2022).
Using AI to Predict Water Point Failure Risk
Identifying water points which are likely to fail before they fail provides decision-makers with the ability to take action to ensure the continuity of services. Preventing a water point from failing has both social and financial benefits, as it allows users consistent and reliable access to an improved source and is more cost effective than repairing a water point after failure. Machine learning (ML) is a subfield of artificial intelligence (AI) which can be used to make predictions based on inferences drawn from patterns in the data.
Initial models predicting current and future waterpoint functionality from historical WPdx data were developed in 2019 in partnership with DataRobot ‘s AI for Good program. Models were built for each country in the WPdx dataset, with a focused pilot in Sierra Leone in coordination with the National WASH Commision. The initial set of models provided interesting insights about the factors which influenced water point functionality, identifying water point age, administrative district location and water point technology as key features. However, two key challenges were identified during the initial model development process: 1) the need for a more robustly cleaned and categorized input dataset and 2) augmenting WPdx data with additional sources that could potentially provide information on factors likely to impact water point functionality.
Updates to WPdx Prediction Modeling Approach
Over the past few years, in collaboration with DataRobot via the DataRobot AI for Good program, WPdx developed a more robust Status Prediction tool which identifies which water points are at the highest risk for failure. This updated version utilizes an enhanced input data set consisting of cleaned and categorized parameters from the WPdx data combined with point data extracted from external datasets on demographics, climate, conflict, environment, and distance to nearby roads, towns, and cities to provide additional relevant location about the context where the water points are located. In addition, the input dataset includes the population within 1km, the estimated water point population, the crucialness and pressure metrics as calculated by the WPdx Rehabilitation Priority tool. Population data is from the most recent available country specific Meta Data for Good High Resolution Population Density datasets available on HDX. A summary of the input dataset parameters is included in the model documentation (see table below). The complete predictions dataset can be downloaded through the Status Prediction tool on the WPdx tools app.
The models are designed to predict whether or not a point is likely to be functional for two specific time horizons: as of today and in 2 years from today, supporting both immediate and long-term planning. For each of these time horizons, the water point is assigned a likely functionality status, including:
- Functional: no change in status from original report
- Newly functional: change from non-functional in original report to functional as of today
- Maintenance recommended: change between predicted status as of today and in two years from today
- Non-functional: no change in status from original report
- Newly non-functional: change from functional in original report to non-functional as of today
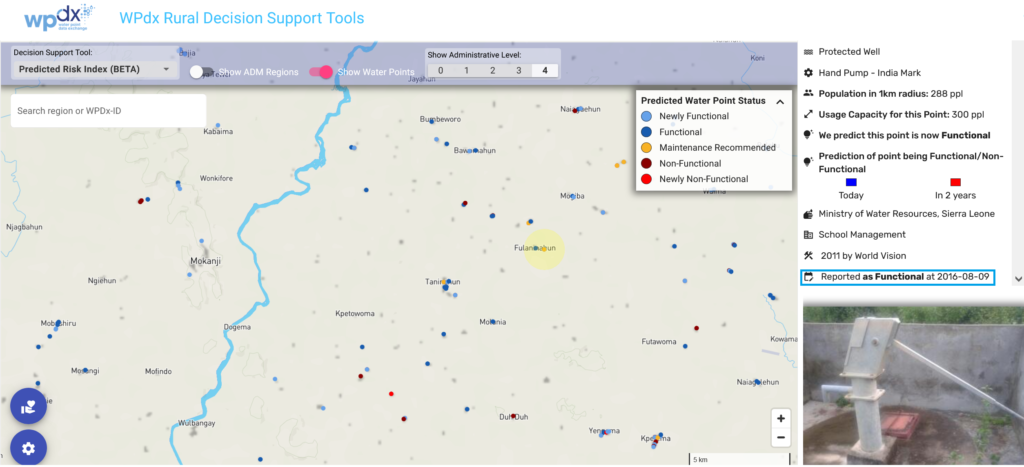
The results from the analysis are available to view in two ways. The first is at the point-by-point scale which shows the predictions for each water point in the dataset. In the example show below, the selected point was last reported to be functional in 2016, and the models are predicting that the point is still functional today, but is at high risk of becoming non-functional in the next two years.
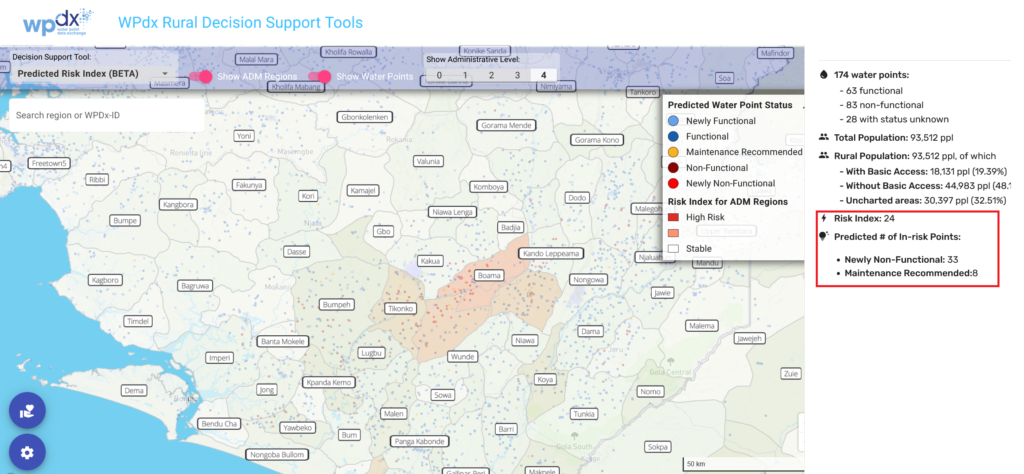
The second is at the administrative division scale which highlights administrative areas which have a higher percentage of high risk points. The darker red regions have a higher Predicted Risk Index. The Predicted Risk Index is calculated as the total number of high risk points divided by the total number of water points within the administrative area. The image below shows an example sub-district area with 33 points which are predicted to be non-functional as of today.
For a video demo on how to use the Status Prediction Tool, please visit our YouTube page for a tutorial (coming soon!).
Model Development
Individual country models were developed and tested against a global model which includes all data from WPdx+. For countries with at least 16,000 water point records, unique country models consistently showed better performance and were selected for deployment. For countries with fewer points, the global model has been used.
Model Updates – Predictions are run on a weekly basis to provide predictions for new data uploaded to the WPdx. Model performance is monitored through DataRobot. If performance decreases and/or a large amount of new data is added, models will be re-trained to incorporate the additional information into the training and test datasets. For a summary of model performance and details, please see the table below:
WPdx Status Prediction Models Documentation
Model Name | Link to Model Documentation |
Global* | |
Ghana | |
Nigeria | |
Sierra Leone | |
Uganda |
* The Global model has been applied for data from Tanzania, Zimbabwe, eSwatini, Liberia, India, Malawi, Ethiopia, Bangladesh, Kenya, Haiti, South Sudan, Central African Republic, Rwanda and Guatemala. The Global Model includes data from Ghana, Nigeria, Sierra Leone and Uganda.
Interpreting the Models
The prediction models can be analyzed to determine which input parameters, or features, are driving the model performance. The top features have the greatest influence on the model and may provide insights on the driving factors for water point sustainability.
The most influential features across all models include:
- Age of water point (time since installation or rehabilitation): Older water points are less likely to be functional compared to newer water points.
- Population data (how many people live within one kilometer of a particular water point, and how many people are estimated to use a particular water point): If a water point has a high local population, it is more likely to be functional. However, if a water point has a high assigned population, it is less likely to be functional.
- Crucialness (percent of local population assigned to a particular water point. If only one water point exists within 1km of a population, crucialness = 100%, if multiple points exist, the population is assigned based on a relative distance calculator and crucialness < 100%): When crucialness is <100%, the water point is more likely to be functional, meaning that water points which are the sole water source for a population are more likely to be non-functional.
- Management type (entity responsible for the water point):Privately operated water points are most likely to be functional compared to other management types.
Other key features include:
- Modeled estimates for Groundwater Recharge and Groundwater Storage from the British Geological Survey (BGS) appear as key features in the Global model, Ghana and Nigeria models: When recharge is greater than 140 mmpa – the likelihood of functionality decreases in linear decline to 180 mmpa. In areas where groundwater storage is low but recharge is high, groundwater supplies are more vulnerable to drought but resilient to long-term irreversible depletion (80% of dataset with recharge > 140 mmpa has groundwater storage less than 1000 mm).
- Pressure (ratio of the number of people assigned to a particular water point to the usage capacity based on the water point technology, expressed as a percentage): Water points with higher pressure scores are more likely to be non-functional.
Next Steps
This beta release of the updated prediction models marks a substantial improvement over the previous set of predictive models. The WPdx team is engaging with stakeholders on the uses of these models and the models will be routinely evaluated and updated based on findings and feedback. If you have questions or comments or are interested in partnering with us on the development of these models, please reach out to info@waterpointdata.org.