

New WPdx Decision Support Tools
We are excited to release the new suite of WPdx Decision Support Tools (v.1.0 beta).
The WPdx Decision Support Tools interactive web app allows users to view and explore available water point data and results from the WPdx+ dataset and suite of decision-support tools.
The decision-support tools provide insights on rural basic water services for each available administrative division, recommendations for where water points should be rehabilitated or constructed, an overview of the average age of available data, and predictions of likely water point status (coming soon). The results from these analyses can provide decision-makers with tangible evidence for allocating resources and developing work plans to improve rural water services.
For more information on each decision-support tool, please visit the following links or open the “Information” pop-up on the web app.
- Administrative Region Analysis
- Rehabilitation Priority Analysis
- New Construction Priority Analysis
- Data Staleness Analysis
- Functional Status Prediction Analysis (coming soon)
Please check out our detailed WPdx User Guide for more information about how to use the entire WPdx platform.
WPdx Decision Support Tools Quick Guide
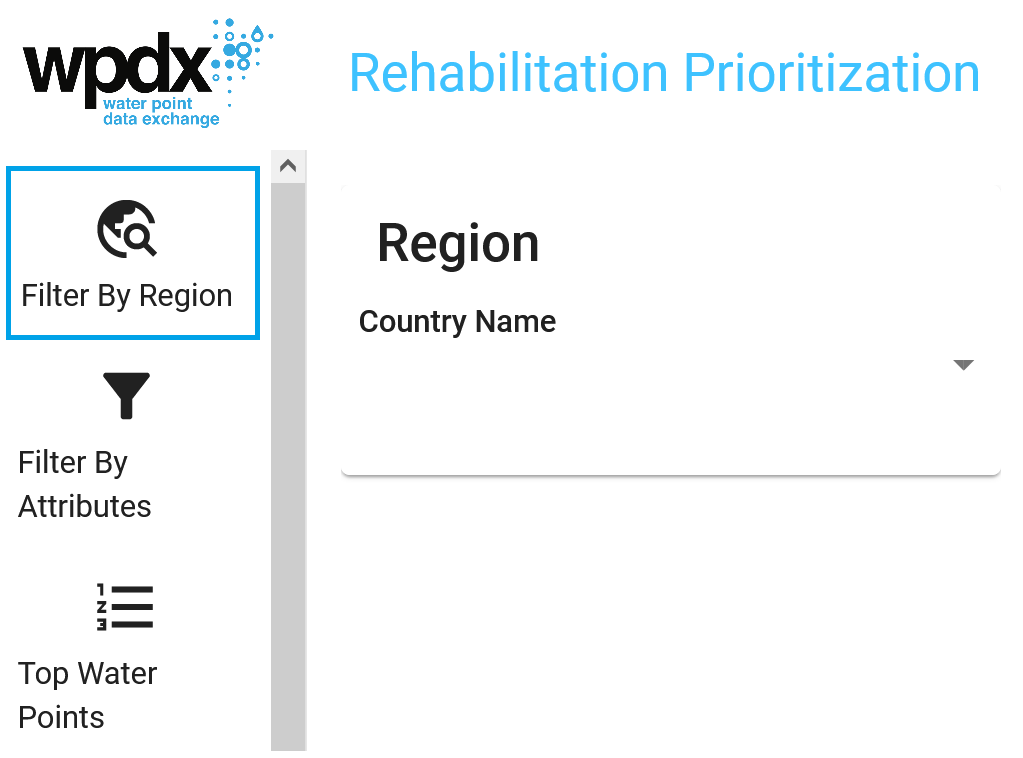
1. Focus. The landing page of the app showcases the entire WPdx+ dataset. From here, users can scroll to view data and results from the global dataset or zoom into geographies of interest by selecting ‘Filter by Region’ from the header bar. Depending on the country, users can filter all the way down to the Admin 4 level.
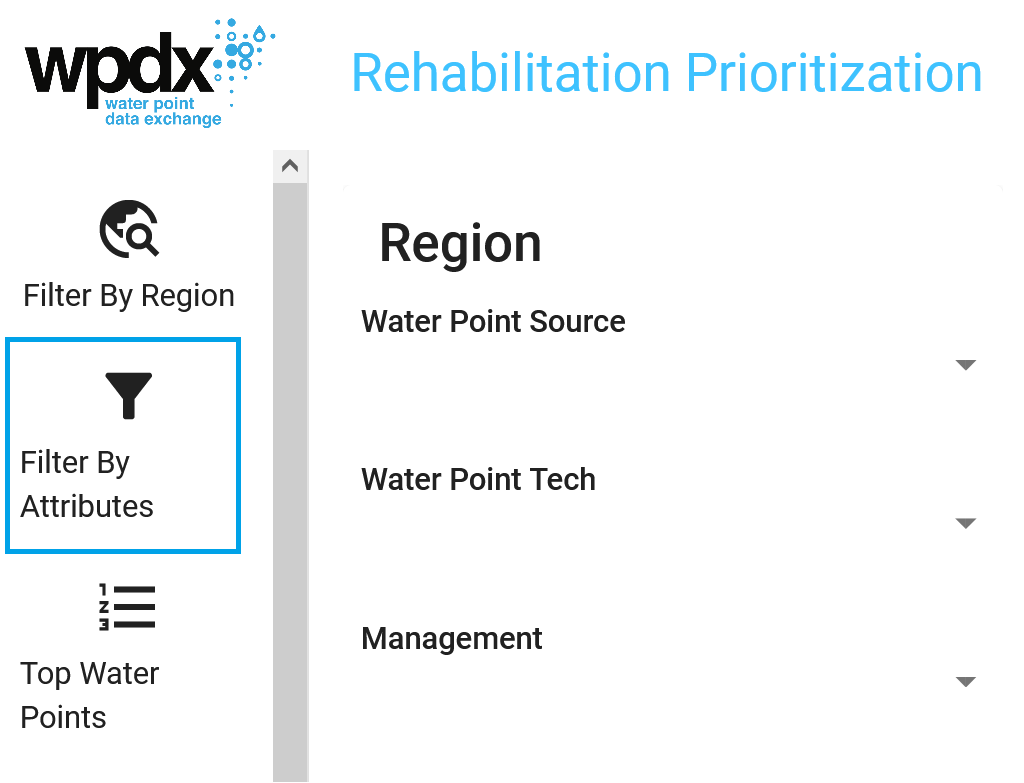
2. Filter. Users can also filter available data by water point source, water point technology or management type if they are seeking information on specific types of water points. Please note that the analyses are conducted on the comprehensive dataset, not on the filtered view.
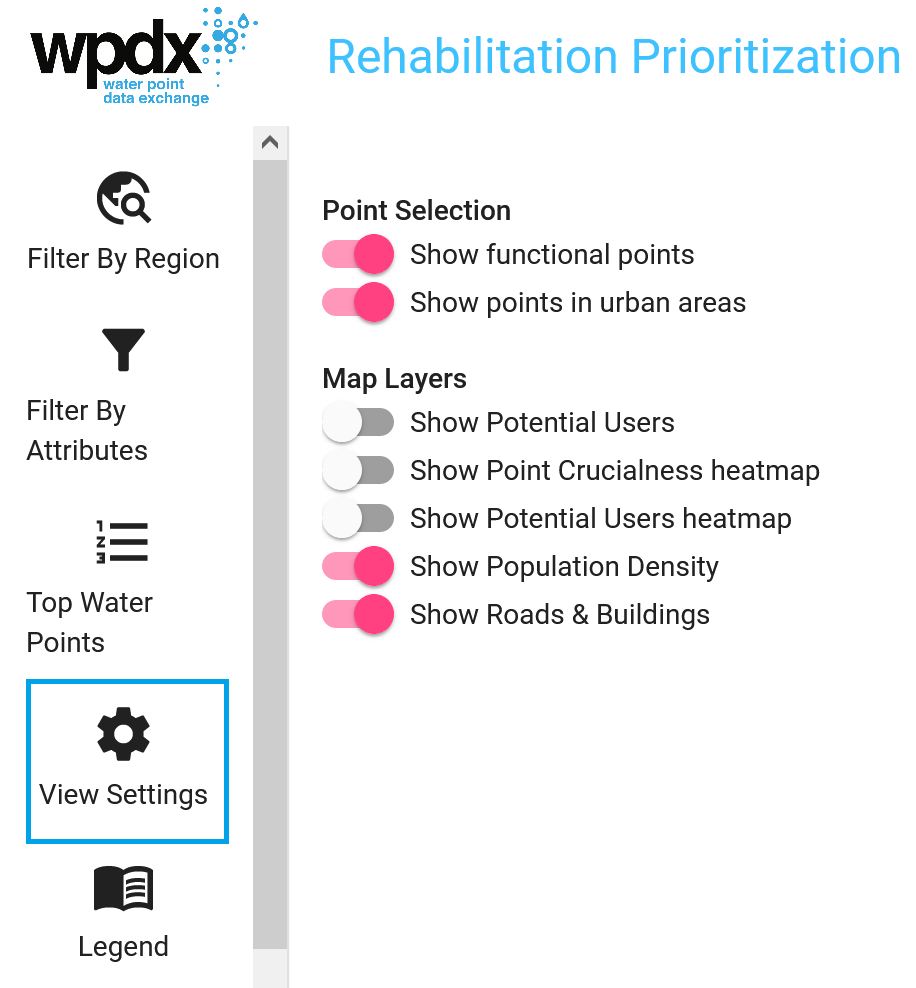
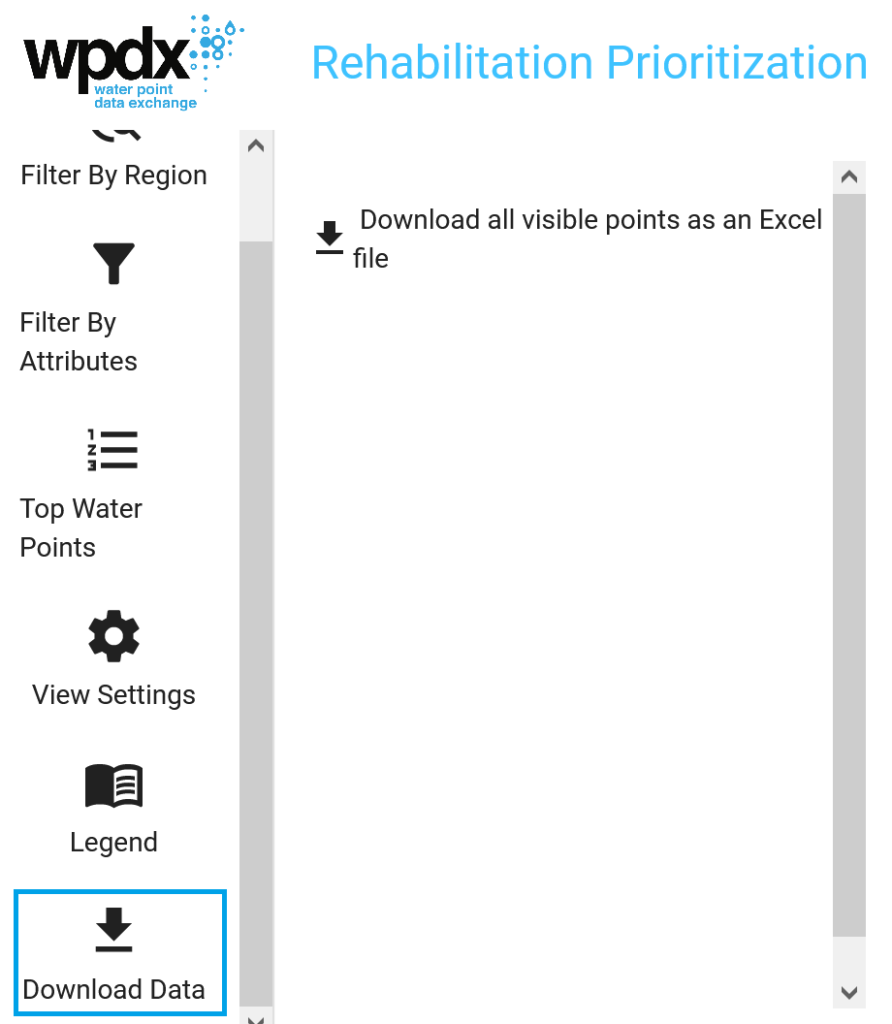
3. Explore. Users can select the desired decision-support tool from the drop-down menu and view the results from each tool for their geography of interest. Results are available for download in CSV format. Select Download data from the menu in the upper left corner and choose the results file.
4. Download. Results are available for download in CSV format. Select Download data from the menu in the upper left corner and choose the results file.
Example Use Cases
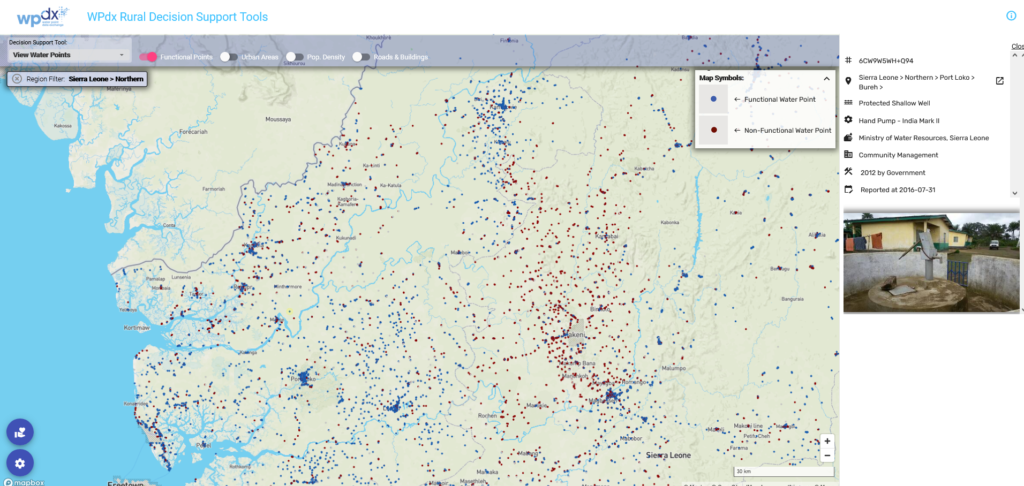
View Water Points
The View Water Points tools allows users to explore all available functional and non-functional water points available in the WPdx+ dataset. Users can choose to filter by region to a specific country, district, or sub-district of interest, and click on individual water points to learn more about that point. Additional filtering options allow users to view water points based on source, technology, and management.
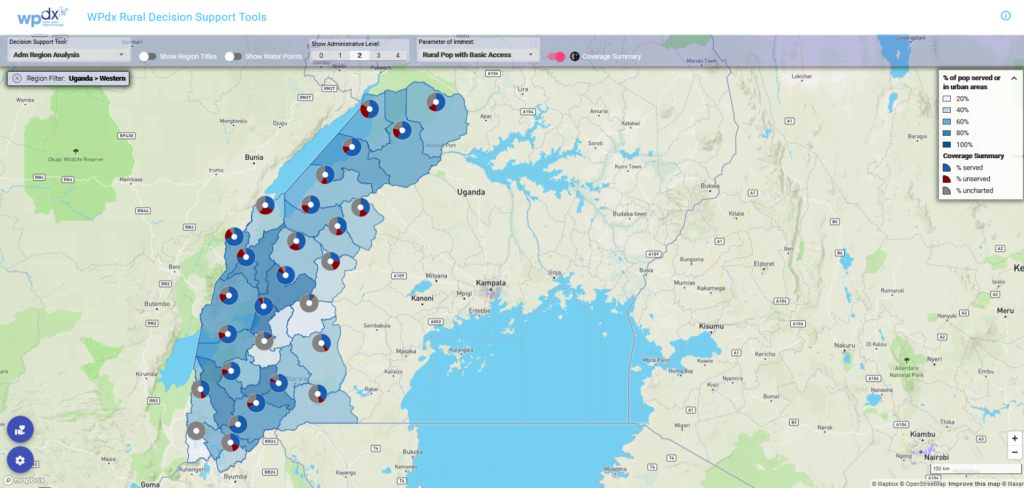
Administrative Region Analysis
The Administrative Region Analysis Tool provides an overview of the rural population with access to basic services, without access to basic services, and uncharted (i.e., data is not available in WPdx to determine access for these populations) for each available administrative level.
- Rural Population with Basic Access: Population within 1km of a functional water point
- Rural Population without Basic Access: Population within 1km of a non-functional water point (but not within 1km of a functional water point)
- Uncharted Rural Population: Population for which no data on water services is available in WPdx. These populations may be without basic access or basic services may exist, but data has not been shared with WPdx.
Users can view chloropleth maps, which provide administrative regional analysis for the percentage of the rural population With Basic Access, Without Basic Access and which are Uncharted.
Illustrative Uses
- Prioritizing administrative divisions for budget and resource allocations
- Identifying target administrative divisions for interventions
- Evaluating equity
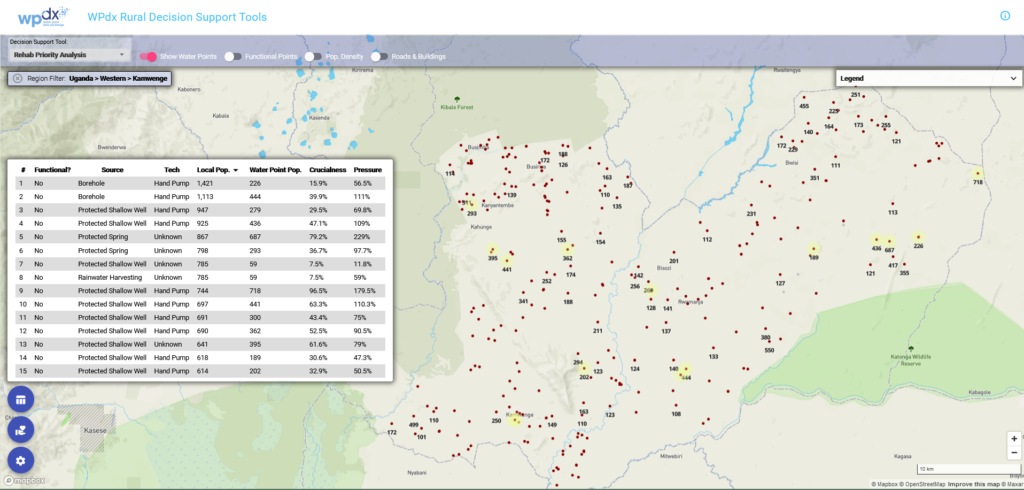
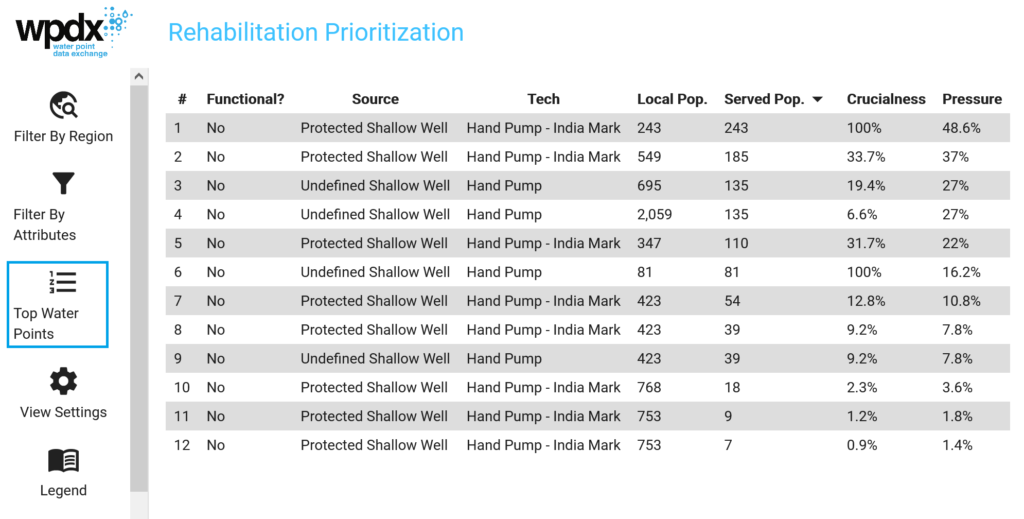
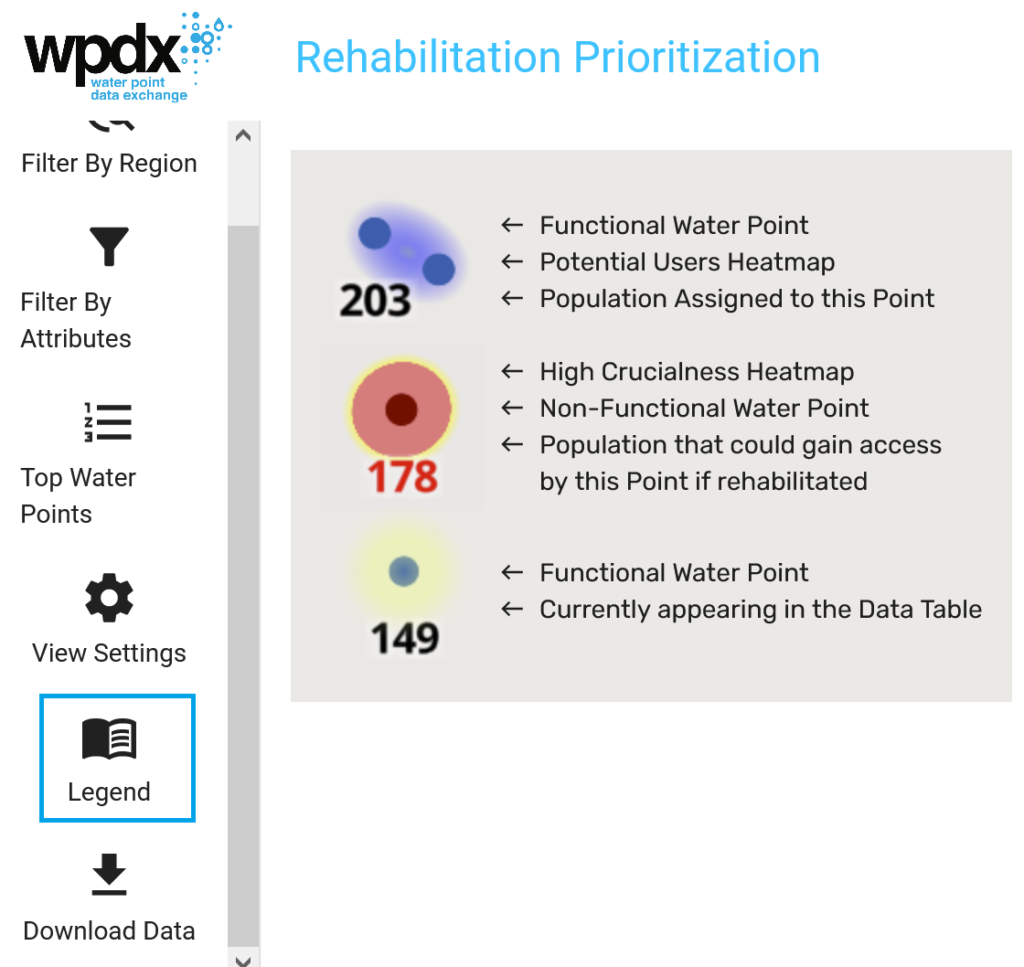
Rehabilitation Priority Analysis
The Rehabilitation Priority Tool provides recommendations for which non-functional water points should be considered for rehabilitation and repair. The tool also provides insights on which water points are critical in that there are limited nearby alternatives and which water points are being over-utilized. Results can be viewed and filtered based on:
- Potential population that would regain access if point was repaired (default)
- Total population within 1km of water point
- Crucialness of water point (i.e., are there alternative water points nearby)
- Pressure on the water point (i.e., is the water point over or under-utilized)
Illustrative Uses
Prioritizing which water points to rehabilitate
- Highlighting areas where there are limited alternative water points available
- Understanding which water points are over- or under-utilized
- Benchmarking rehabilitation needs to inform district budgets and workplans
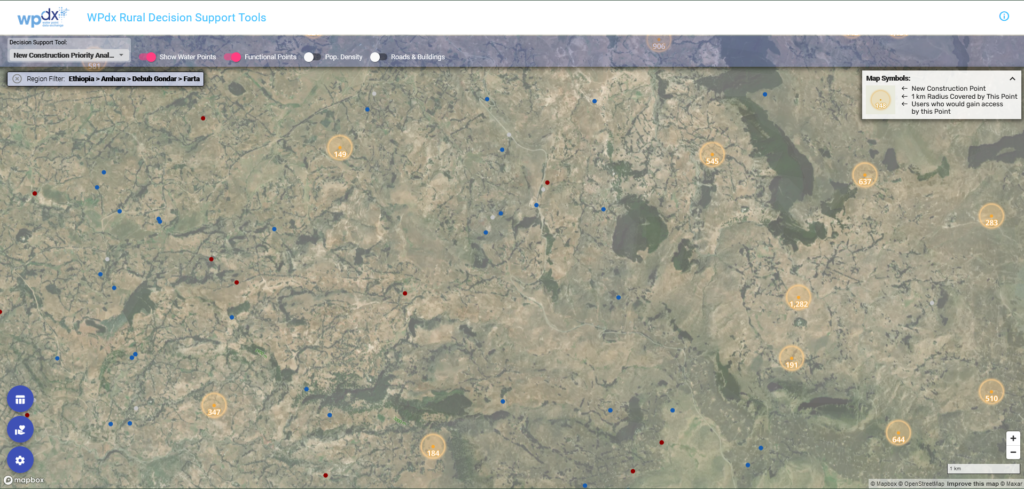
New Construction Priority Analysis
The New Construction Priority Analysis Tool evaluates all possible locations where a water point could be constructed in a given administrative area and evaluates how many people that are not near an existing water point (regardless of functionality) could gain access if a water point was constructed in that location.
Illustrative Uses
- Identify locations to construct new water points
- Evaluate the relative benefit of new construction compared to rehabilitating existing water points
- Provide insights on potential data gaps which could be filled by uploading data to WPdx
Data Staleness Analysis
The Data Staleness Analysis provides a relative measure of the average age of data available from the WPdx+ dataset.
Illustrative Uses
- Identifying areas for targeted data sharing outreach
- Selecting areas for focused data collection
- Ensuring a clear understanding of the age of data available for other analyses
Questions and Feedback
Please contact info@waterpointdata.org with any questions.
Interested in sharing data with WPdx? Please see here for more details.

