

Photo courtesy of Project team/Gulu YouthMappers
With contributions from Stella Nacakwa, M.S. Candidate, West Virginia University & Courtney Clark, YouthMappers.
The YouthMappers Chapter at Gulu University, in partnership with YouthMappers, West Virginia University, the Water Point Data Exchange (WPdx) and the U.S. Agency for International Development (USAID)recently launched the Uganda Water Infrastructure Mapping Project (U-WIMP). The U-WIMP project has two complementary goals including:
- building the technical capacity of Ugandan YouthMappers in both mapping and spatial decision-support analysis, and
- supporting the Gulu District Water office in making evidence-based decisions through the collection of digitized water data and the application of cutting-edge data analytics.
Water point data collection in Gulu has historically been paper-based, making it challenging to compile, analyze, share, and use the data to inform decisions. The YouthMappers U-WIMP project will provide much-needed data updates as well as pilot an approach to digitize drinking water resource monitoring. Dr. Denis Nono, a Gulu University lecturer specializing in water resources, and advisor to the project, applauded the engagement of YouthMappers students as this will provide a significant resource to the Gulu Water District Office as well as a hands-on learning opportunity.
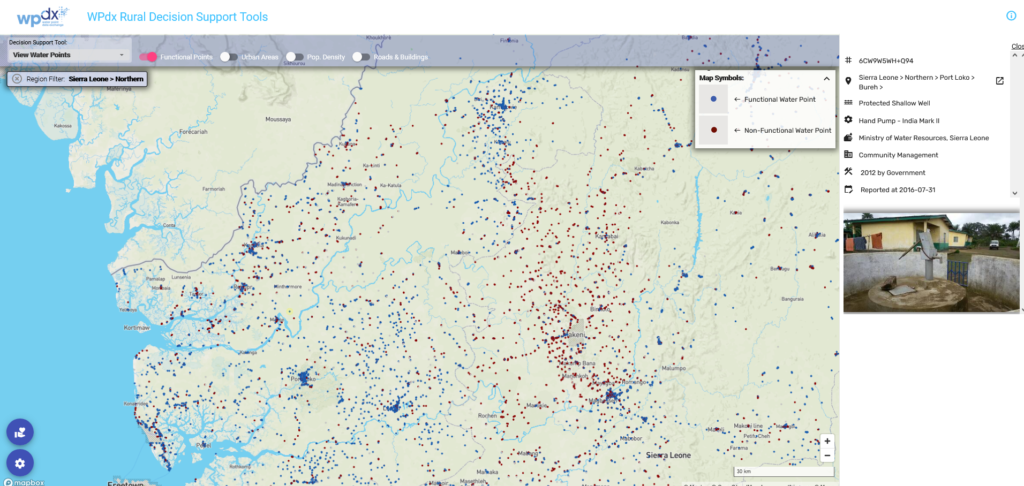
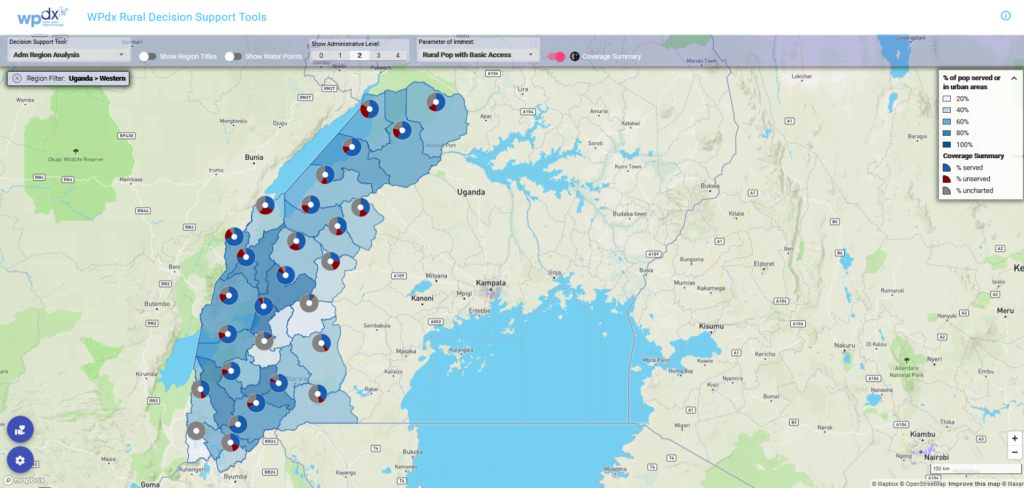
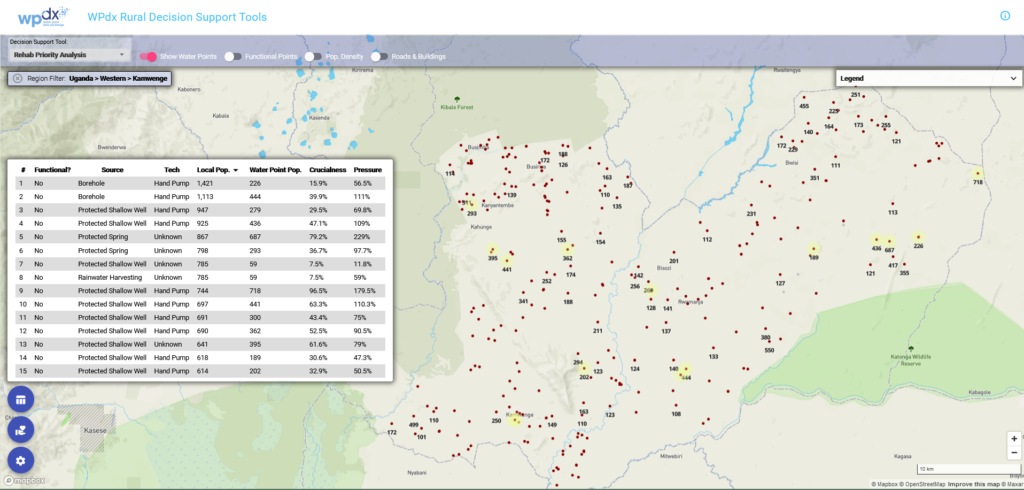
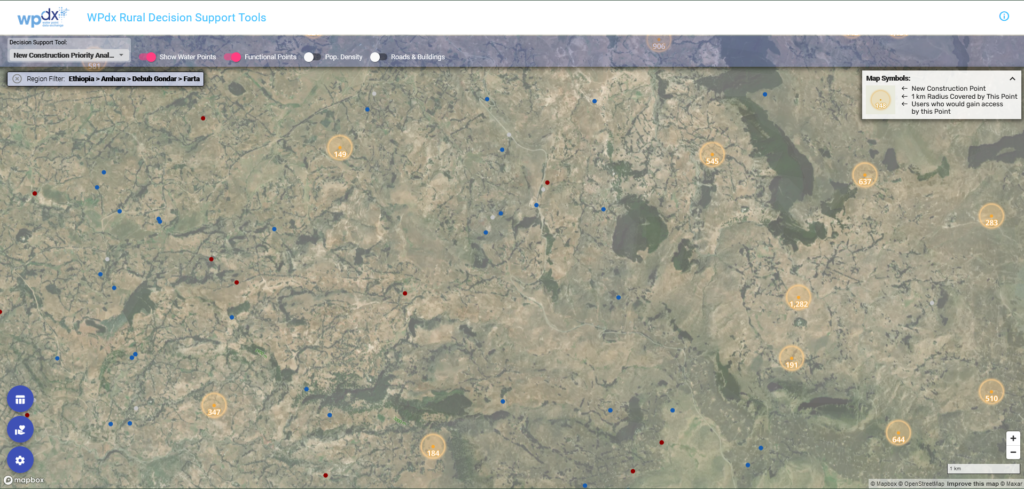
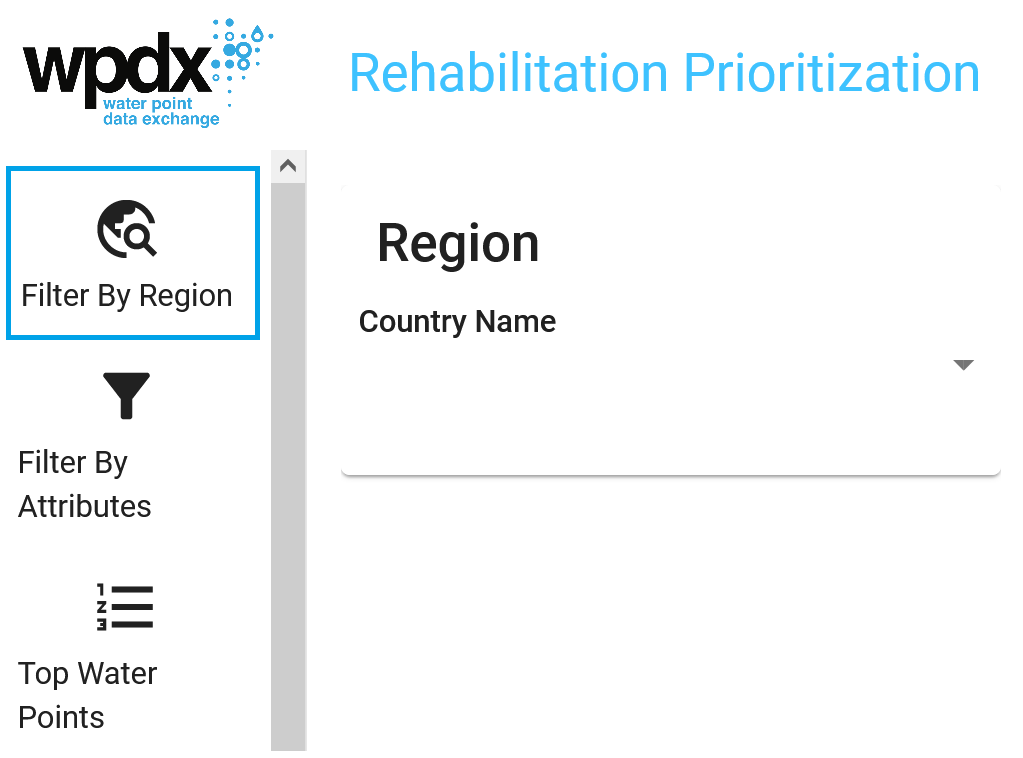
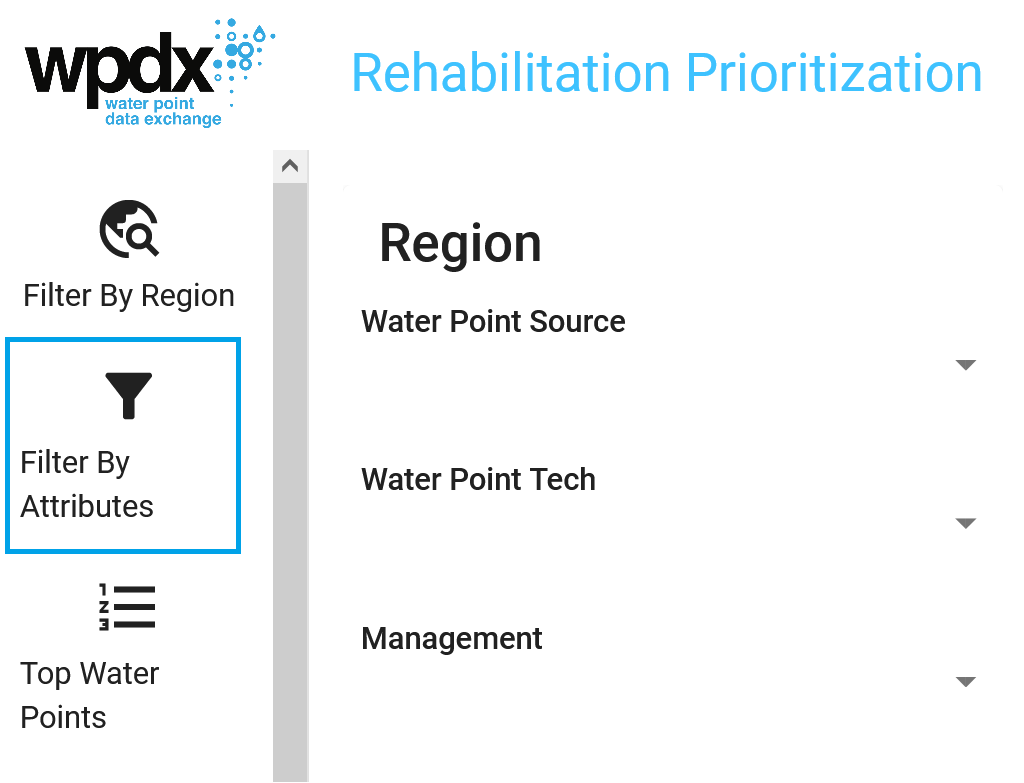
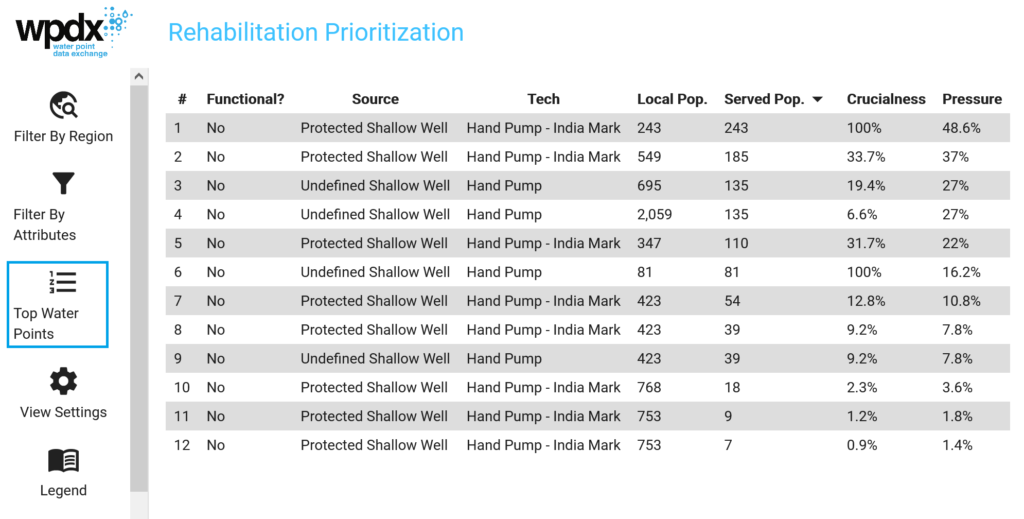
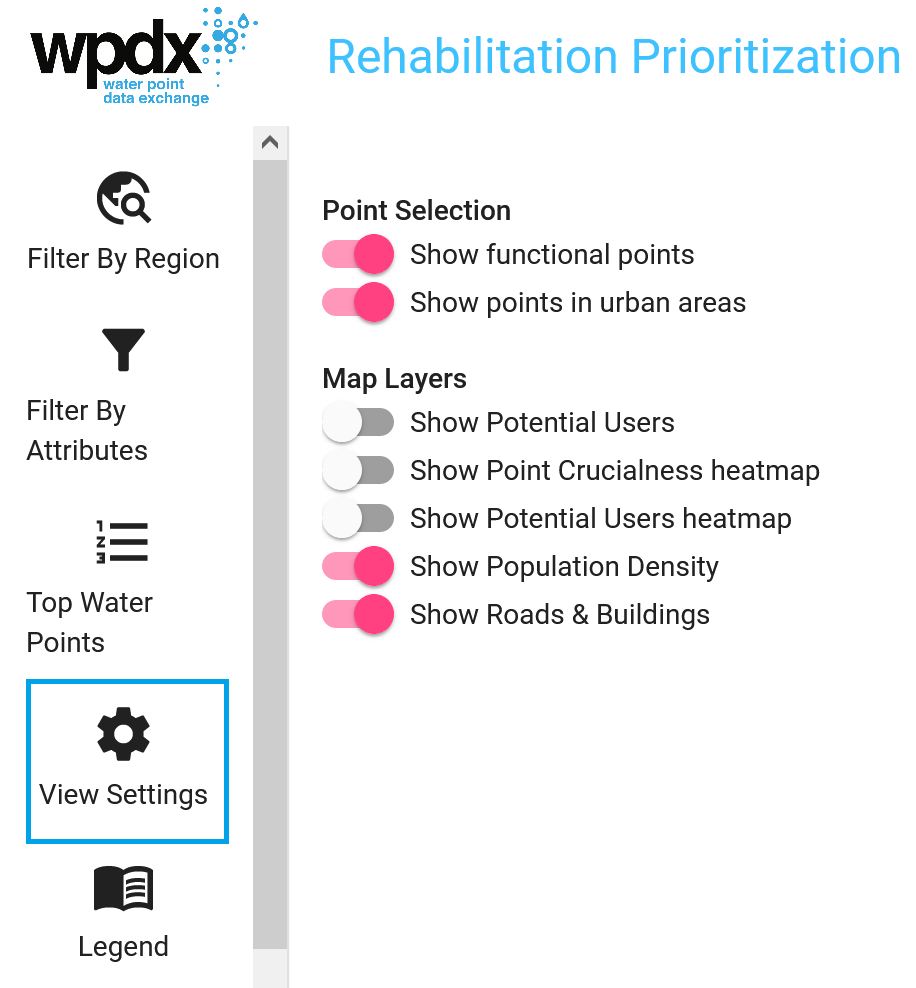
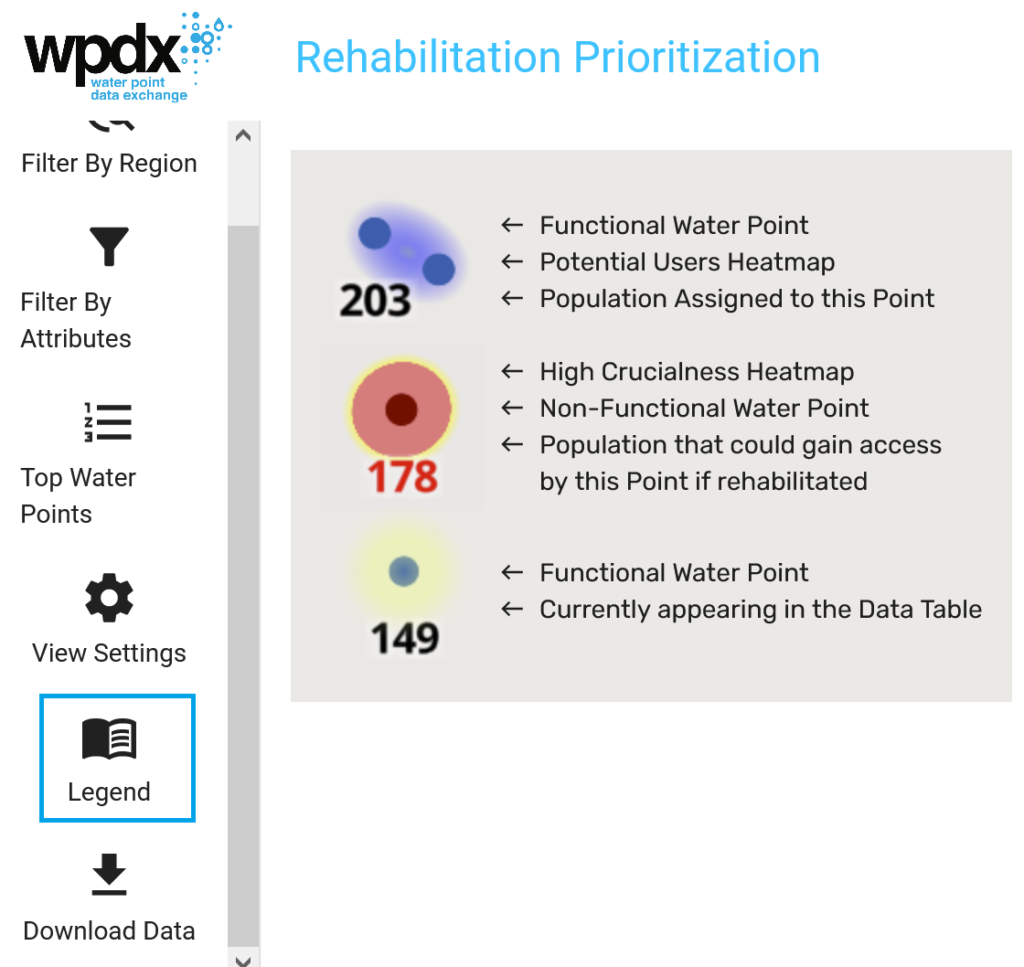
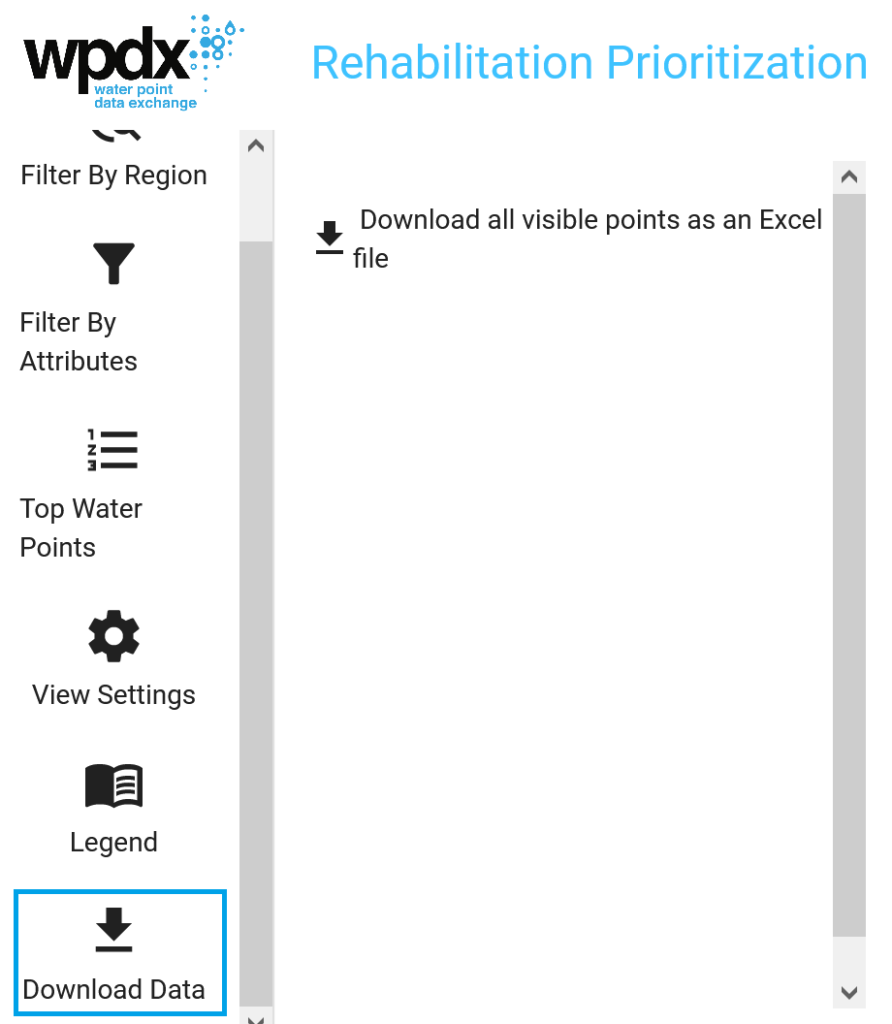
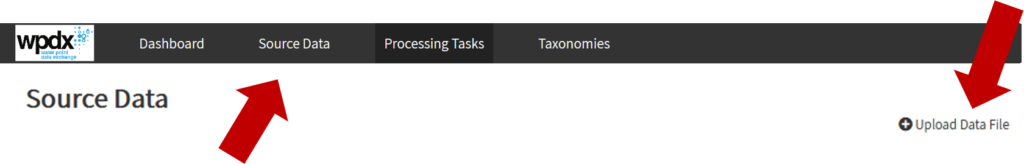
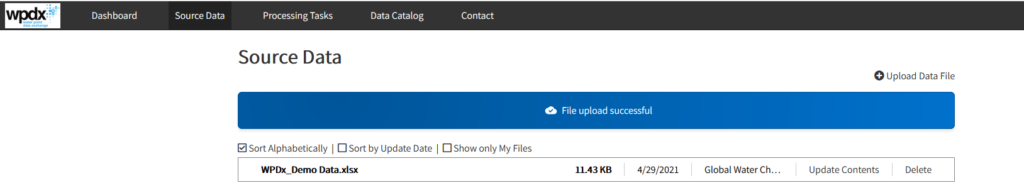
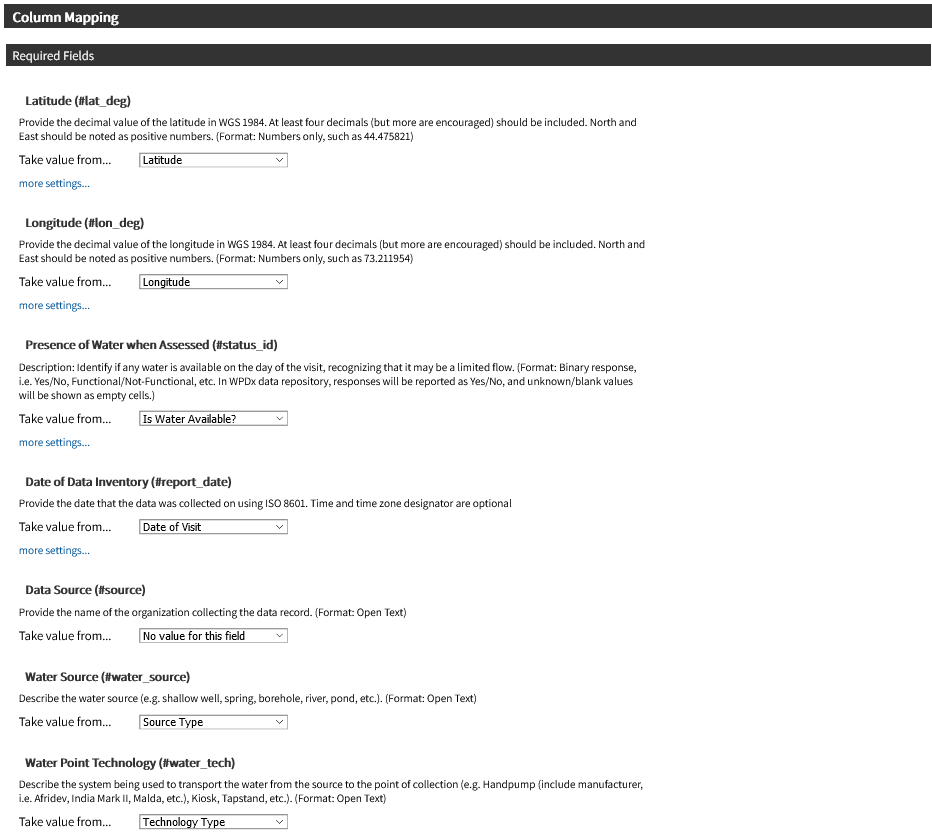
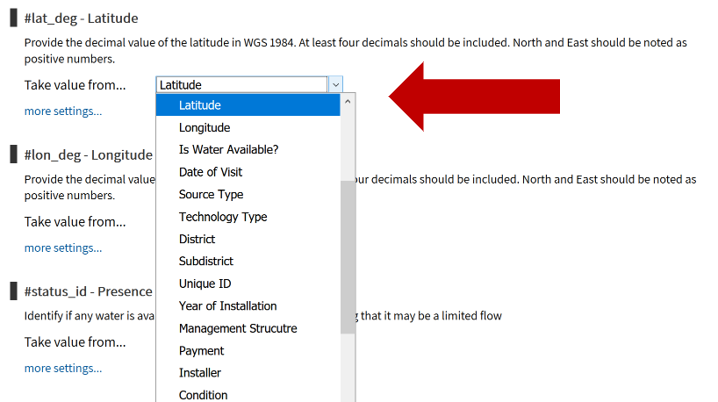
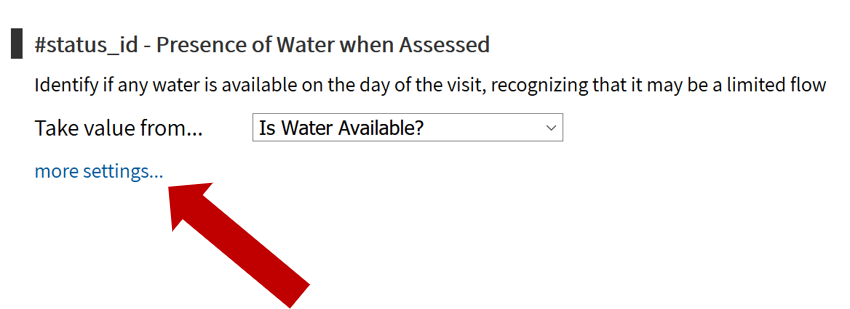
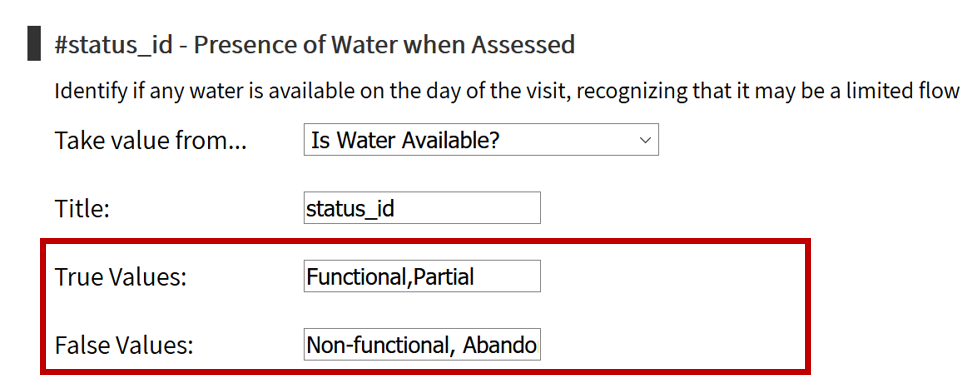
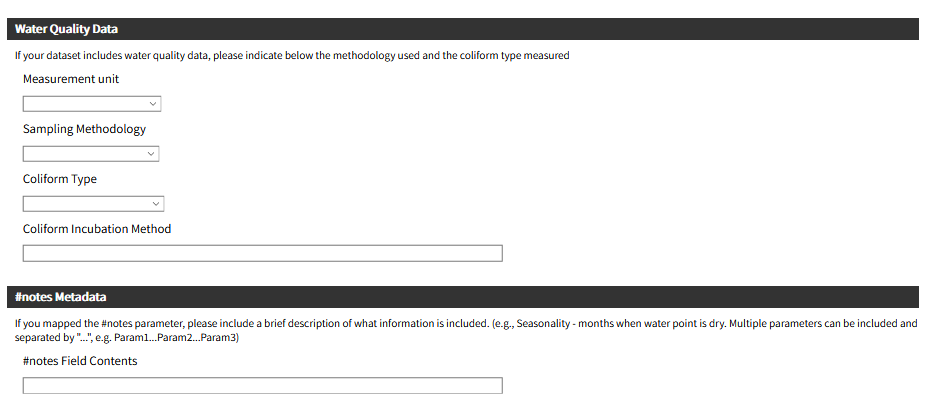
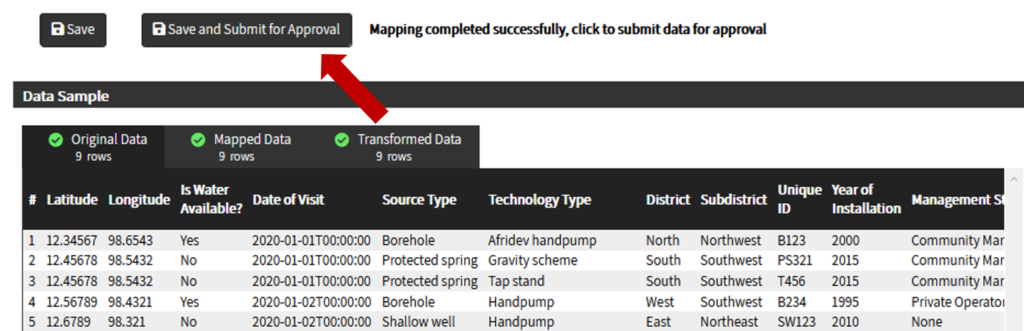
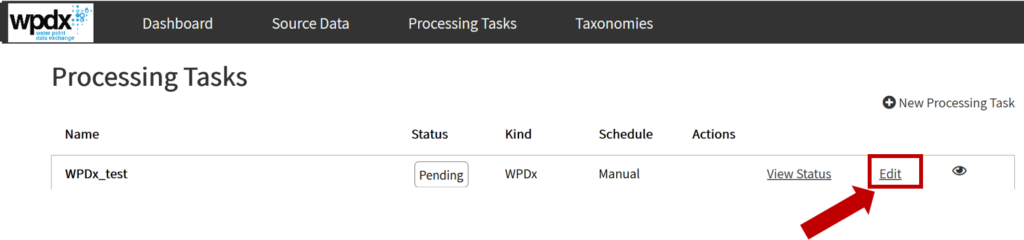
Data collected through the project will be uploaded and harmonized with existing records on the Water Point Data Exchange (WPdx). WPdx is an online platform for sharing, accessing, and using water point data that currently hosts over 600,000 records from over 50 countries. The WPdx database includes 557 water point records in Gulu District, reported between 2010-2022. WPdx hosts a suite of decision-support tools designed to provide decision-makers with information to optimize limited resources by prioritizing locations for investments including preventative maintenance, rehabilitation, and new construction, and providing updated estimates on drinking water service coverage in rural areas for local communities, host country governments, and watershed authorities. Results from the decision-support tools are visualized on interactive web-maps and summary graphs which can be utilized by a range of audiences. Additionally, the collected data will be utilized in combination with high-resolution satellite imagery to build models which can automatically detect water points.
Following data collection and analysis, the team will host a series of workshops with government, NGO and academic stakeholders to share the findings and explore how the information can be used to inform decision-making processes and work planning in the district.
The project activities will build the chapter student members’ technical knowledge of the water sector and serve to connect these youth with their communities. The project also emphasizes gender considerations through the YouthMappers Everywhere She Maps campaign which seeks to improve the availability of geographic datasets for women’s economic empowerment.
This project will also raise global awareness among YouthMappers Chapters of the importance of evidence-based decision making and effectively managing water points and water resource allocation, and it will build on WPdx’s current work to improve decisions which ultimately lead to an increase in sustainable access to water services.
Project Objectives
- Build capacity of the Gulu University YouthMappers chapter through introduction to rural water challenges and practical experience in collecting field data.
- Pilot deployment of a team of YouthMappers students utilizing open-source software to collect up-to-date digitized water point data to provide a better understanding of current water access and create a more updated dataset for analysis through the WPdx platform.
- Partner with district, regional, and national government authorities to integrate findings from decision-support tools into budgeting and planning decisions.
- Explore the feasibility of using satellite imagery to identify existing water points, both manually and through AI/ML predictive models to help build a more comprehensive inventory which can then be used to help prioritize investments in water point monitoring, preventative maintenance, and rehabilitation to support sustainable service delivery.
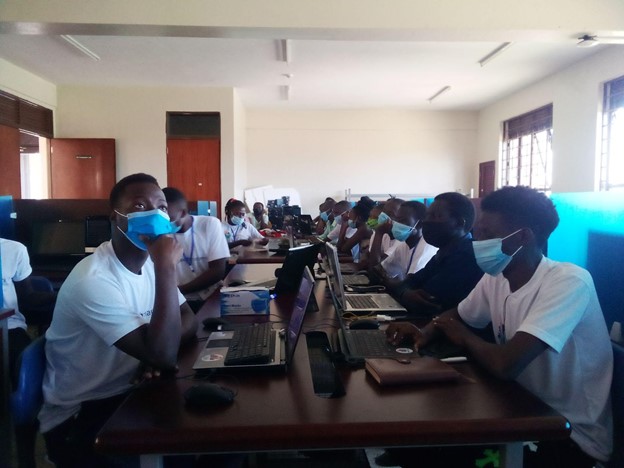
Photo courtesy of Project team/Gulu YouthMappers
Project Timeline
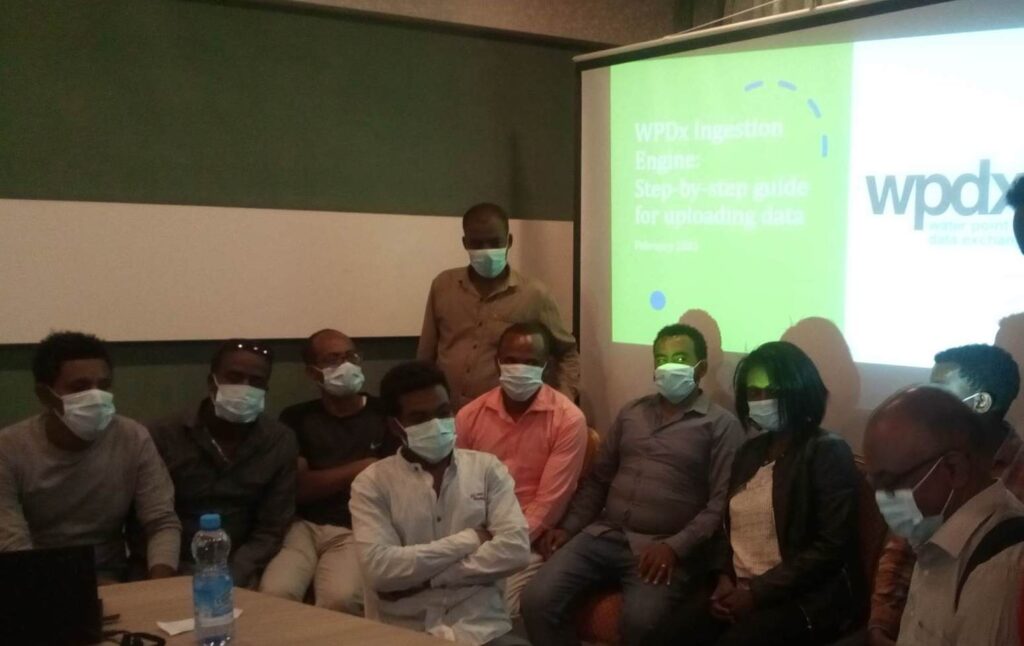
An initial set of in-person trainings for the University of Gulu YouthMappers student chapter was held in December 2021 and January 2022 including introductions to rural water, OpenStreetMap, WPdx and a practical session on water point data collection. Virtual trainings have continued throughout early 2022 focused on the application of OpenStreetMap to map and visualize features. Additional details and updates on progress on the project can be found on the OpenStreetMap wiki platform.
Next Steps
A comprehensive data collection effort for two sub-counties in Gulu district is scheduled for early summer 2022. Collected data will be cleaned and uploaded to both OSM and WPdx. Collected data will also be utilized to build a training data set using high-resolution satellite imagery for the development of models which can automatically detect water point locations. Decision-support analyses to estimate current coverage levels, and priority areas for rehabilitation, new construction and preventative maintenance will be conducted through the WPdx platform. The results of the data collection and combined analyses will be shared with government and NGO stakeholders during a collaborative workshop.


