WPDx Sets its Sights on Achieving its Updated Mission

In 2014, the Water Point Data Exchange (WPDx) was launched to tackle a widely-identified issue: organizations in the WASH sector were not coordinating as well as they could be. Part of the issue, as identified by numerous sector experts, was that data about water access projects were not shared transparently or in a standardized way. Through tireless advocacy since its launch, WPDx has seen tremendous growth in the sheer volume of water point data available. Ultimately, this has led to better coordination among stakeholders in the WASH sector. Organizations are now sharing their harmonized data more regularly and encouraging their partners to do the same. With better data, actors in this space can effectively plan and collaborate with one another. This momentum prompted the WPDx team to ask the question: well, now what?

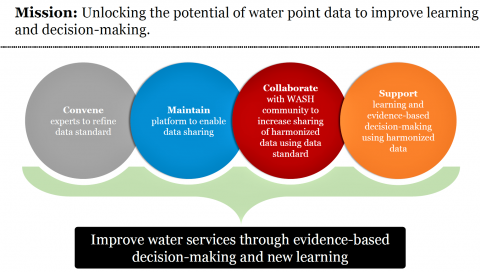
In response to that question, the WPDx mission and theory of change were born. WPDx has unified its efforts behind a mission to “Unlock the potential of water point data to improve learning and decision-making.” Next, the team established the theory of change (see attached picture) — the work streams undertaken to achieve the mission. Finally, the outcome of these define the vision of WPDx: Improve water services through evidence-based decision-making and new learning.

The mission, vision and theory of change were initially crafted by the WPDx team, then taken to the group of experts that comprise the WPDx Working Group. It was agreed unanimously that they clearly capture some of the key needs of the WASH sector upon which WPDx can bring its expertise to bear.  

The WPDx team is working each day to make this vision a reality. We’d love for you to join us – you are invited to share your ideas, feedback, expertise, and especially data as we continue this journey.

The Era of Precision WASH

We are entering a new era in the WASH sector. Nearly a decade ago, a small NGO called Water for People developed a mobile phone application that could allow users to map their water infrastructure. This innovation became Akvo Flow and provided a massive jump beyond the previous approaches of paper and pen. Over the past 10 years, we have seen steady progress – new tools being launched, ever more data being collected, innovative technologies that allow for those same phones to measure water quality, and even a standard for sharing data across organizations.

Five years ago, it seemed an ambitious target to have WASH data collected throughout West Africa. As I have just seen at the WCARO-ASWA meeting in Conakry, supported by DGIS and UNICEF, this in now the norm. Governments from Benin, Central African Republic, Côte d’Ivoire, Ghana, Guinea Conakry, Liberia, Mali, Mauritania, and Sierra Leone all shared dynamic presentations about their achievements in collecting data on water and sanitation, and their aspirations to use this data to transform WASH services. So much progress has been made that the fact that this data is available now seems almost commonplace. It is time to build on this good work and take the next step.

As a global WASH sector, we need to move beyond this steady progress and take another massive leap. We must usher in the era of precision WASH. Harnessing unprecedented evidence will allow us to optimize decisions. We can use data to maximize impact while reducing cost. We can predict, for the first time ever, which water points are going to break before they leave communities devastated, and fix them in advance. We can determine which broken water point, out of thousands, should be fixed first to help the greatest number of people.

Our work is too important to continue grasping for answers in the dark. We must all work together to launch ourselves into the world of precision WASH. Doctors are already using precision medicine to tailor treatment to each individual patient, based on their medical history. Farmers are benefitting from precision agriculture that tells each one exactly which crops to plant where and when, given their unique geology, soil characteristics, and market needs. Farmers can even buy seeds that come with insurance, made possible through robust predictions about how those seeds will perform in that farmers field.

We are already beginning to slip behind in the WASH sector, but we can still catch up. By using harmonized and shared water point data, we can begin collectively building the foundation for precision WASH today. When data is standardized, powerful analysis can also be standardized, ensuring that all countries are able to benefit from actionable insights at the same time, for much lower investment. In the coming weeks, WPDx will be rolling out the first tools that will provide decision support for governments around the world on the most important decisions they make.

Governments and their partners have spent the past decade collecting data to build the foundation for precision WASH. Now, we all need to work together to ensure that no government is left behind as our sector takes a giant leap into the future.

To see the first steps being taken in precision WASH, watch this brief segment from our recent webinar here

How Water Point Data are Improving Services

This blog post, written by Nicolas Dickinson and Felix Knipschild, originally appeared on the IRC blog.

Recent research by WASHNote and IRC Uganda shows how data about water points are being used to improve drinking water services. The research provides actionable guidance for national and local governments, NGOs and donors on how to make the best use of water point data.

From water points to improving services

Achieving Sustainable Development Goal (SDG) 6 by 2030 requires accelerating progress and investment dramatically and a shift to providing services instead of infrastructure. National policy targets and the SDGs are not going to be met at the current rate of investment and failure of existing infrastructure due to a lack of service monitoring using water point data.

Evidence on the actual state of basic and safely managed services, including the location of water sources and water supply and their other attributes, will be pivotal for accelerating progress and ultimately achieving SDG 6.1. It is crucial for decision makers to understand this role of water point data.

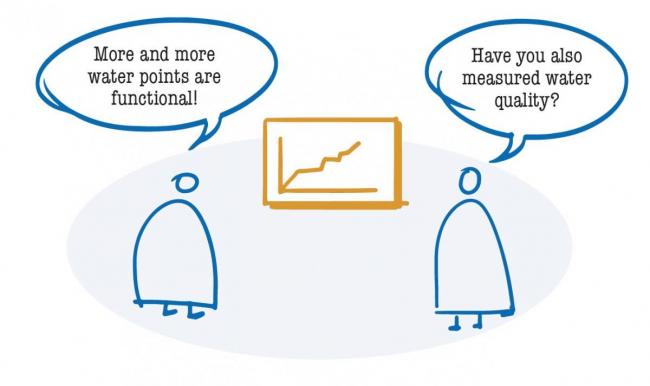
Local governments require more information than functionality alone to assess water service levels


How data are improving services

Water point data are typically collected by community or geographical area and sometimes with a name, identifiers and/or GPS coordinates. Collecting these data is relatively expensive when it is not included in routine operations. Many inventories are undertaken only once without a plan for routine updates.

National governments have used water point data to develop national policy targets and inform joint sector reviews. Local governments have used water point data to assess services, plan corrective actions, for example identifying hand pumps for rehabilitation, training water committees, and lobbying for funding. Today, it is possible for international and local stakeholders to find each other, work together and advocate for improving services.

Universal lessons

While there is great potential, some challenges hamper the widespread use of water point data, for instance the focus on one-off data collection, diverse approaches to collection and analysis, and the extent to which data are – or are not – being shared publicly. However, there are a number of universal lessons that everyone should take on board. This will enable us to make better use of water point data:

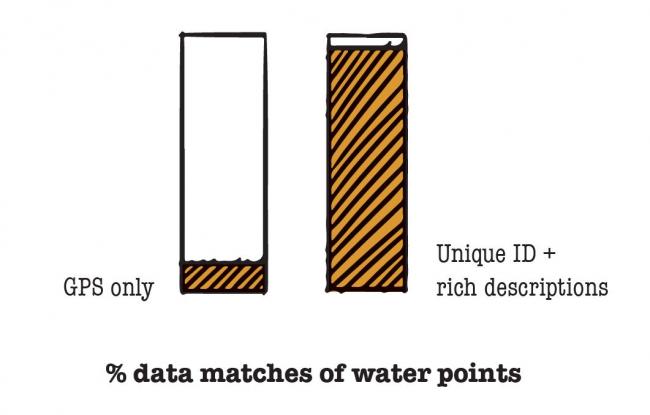
1. Use unique identifiers, rich descriptions and photos to ensure water point records are unambiguous and can be tracked over time. It should be possible to update a water point based on a phone call with a vendor or caretaker.

Water points are more easily matched when the data entry includes an unique ID and a distinctive description

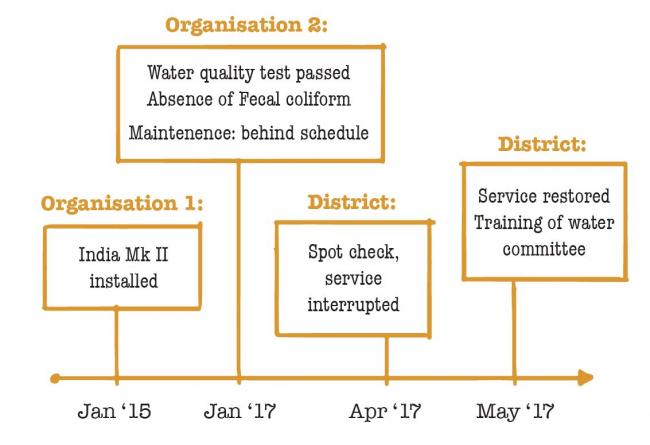
2. Publish points to the Water Point Data Exchange (WPDx) and National Water Atlases to ensure that these records and unique identifiers are known and reused.

Data that are collected and shared by different organisations provide a timeline for each water point


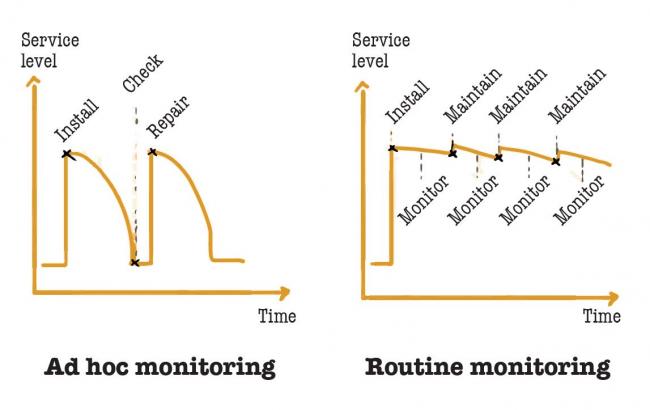
3. Contribute resources to national and district water monitoring and evaluation systems to ensure routine monitoring and evaluation of services. The Direct Support Cost Tool can estimate district requirements and GLAAS/TrackFin can help estimate national requirements.

Ad hoc monitoring versus routine monitoring (based on WASH conference 2011)


National and local governments, NGOs, donors, and implementers each have different roles in ensuring sustainable services. The white paper “Harnessing water point data to improve drinking water services” provides actionable guidance for each role on how to use water point data and improve water point monitoring based on existing practices and the experience of the authors working on water point monitoring programmes and tools. There are complementary 2-page fact sheets available with detailed recommendations for each of the audiences.

The White Paper builds on a) more than 30 cases from government, development partners and the private sector; b) the experiences of users of the Water Point Data Exchange; c) interviews with leaders in the space of water point monitoring; and d) action research in Uganda, a country leading in the use and publication of water point data.

You can read the White Paper and action briefs here:

The White Paper is developed by WASHNote and IRC Uganda on behalf of the Water and Development Alliance (WADA), through the support of USAID and The Coca Cola Company.

APT Helps Transform Data into Decisions

Analytics software company Applied Predictive Technologies (APT) recently partnered with WPDx to carry out an evaluation of one of the world’s largest publicly available monitoring data sets. Covering nearly 400,000 water sources – such as wells or pumps – in more than 30 countries around the world, the WPDx data library is entirely free and open to the public. The evaluation focused on several countries, including Sierra Leone, Swaziland, Uganda, and Liberia and resulted in several actionable findings.
 
The goal was to create data-driven recommendations and tools to improve water access in developing countries. APT’s analytical experts utilized their suite of software and processes to examine patterns in water availability. Characteristics analyzed included countries’ investments, policies, demographics, and climate as well as water source type, age, and service area (among others).
 
Key analyses and results include: 
  1. Drivers of Clean Water Access: Examining more than one hundred different traits (such as population, demographics, employment, sanitation policies, and the average age of water sources), APT explored the possibilities and limitations of using existing data to understand drivers of water access at a national level.
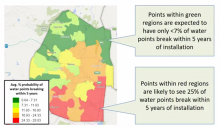
  2. Predictive Modelling on Water Access: Exploration into water point age, repair-service area, demographics, and other traits enabled APT to create a forecast model on the longevity of individual water sources. These findings can allow governments to make data-driven decisions on how they plan their budgets for operations and maintenance, as well as how to more effectively invest monitoring resources. 
  3. Prioritizing Water Investments: By mapping high-resolution population data over water point data, APT created an algorithm focused on delivering clean water to the greatest number of currently unserved people at the lowest possible cost. This algorithm provides governments and others with the tools needed to prioritize their investments, both for rehabilitating water points and building new water sources.
To help disseminate these learnings, WPDx will be hosting a public webinar in Q4 2017, as well as producing an in-depth blog series on several key recommendations, decision frameworks, and tools based on the results of the APT evaluation.

New Article Published using WPDx Data

A team of researchers from the University of Southampton and UNICEF have leveraged WPDx data in a new article published in the “International Journal of Hygiene and Environmental Health.” The article by Weiyu Yu, Nicola A. Wardrop, Robert Bain, and Jim A. Wright uses WPDx data and other water point mapping data to explore the potential for linking water point data and census data for enhanced monitoring. 

You can view “Integration of population census and water point mapping data – A case study of Cambodia, Liberia and Tanzania,” here, though it requires access to read in full. The abstract is proivded below.

Sustainable Development Goal (SDG) 6 has expanded the Millennium Development Goals’ focus from improved drinking-water to safely managed water services. This expanded focus to include issues such as water quality requires richer monitoring data and potentially integration of datasets from different sources. Relevant data sets include water point mapping (WPM), the survey of boreholes, wells and other water points, census and household survey data. This study examined inconsistencies between population census and WPM datasets for Cambodia, Liberia and Tanzania, and identified potential barriers to integrating the two datasets to meet monitoring needs. Literatures on numbers of people served per water point were used to convert WPM data to population served by water source type per area and compared with census reports. For Cambodia and Tanzania, discrepancies with census data suggested incomplete WPM coverage. In Liberia, where the data sets were consistent, WPM-derived data on functionality, quantity and quality of drinking water were further combined with census area statistics to generate an enhanced drinking-water access measure for protected wells and springs. The process revealed barriers to integrating census and WPM data, including exclusion of water points not used for drinking by households, matching of census and WPM source types; temporal mismatches between data sources; data quality issues such as missing or implausible data values, and underlying assumptions about population served by different water point technologies. However, integration of these two data sets could be used to identify and rectify gaps in WPM coverage. If WPM databases become more complete and the above barriers are addressed, it could also be used to develop more realistic measures of household drinking-water access for monitoring.

Feedback Requested: Proposal To Add Water Quality Attributes

A new proposal has been made by Global Water Challenge to modify the WPDx standard and the global WASH community is invited to provide feedback. Please see the full proposal here, and provide and feedback in the commments. Feedback will be accepted until June 23.

The attributes being proposed include:

  • Proposed Attributes
    • #fecal_coliform
      • Results of e. coli or thermotolerant coliform water quality test in a 100ml sample. If thermotolerant, must be noted in the metadata.
      •  Can be either a positive whole number value or “Presence”
    • #subjective_quality
      • Information regarding the perceived quality of the water including taste, appearance, and/or odor
      • Open text field
  • Proposed Metadata Questions
    • What methodology was used to determine fecal coliform?
    • Was the methodology looking at e. coli or thermotolerant coliform?

Living Water International Shares Over 3,000 Water Point Records, Adding 5 New Countries to WPDx

Living Water International has demonstrated a strong commitment to collaboration and transparency by sharing over 3,000 water point records across 20 countries through WPDx. This valuable contribution adds key additional information to existing countries with extensive coverage in WPDx such as Kenya, Uganda, Ethiopia, and Liberia, helping to provide a more complete picture. Beyond adding to existing country datasets, the data from Living Water International also provides the first WPDx data in five countries, including the Central African Republic, El Salvador, Haiti, Namibia, and Zimbabwe. This data also pushed WPDx past the milestone of 300,000 data points for the first time.

Living Water International has a long history of collaboration and transparency, being among the earliest supporters of the WASH Sustainability Charter and as a co-founder of both the Millennium Water Alliance and the Accord WASH Alliance.  

According to Jonathan Wiles, VP of Strategy & Program Development, “We’re committed to doing our work collaboratively, helping communities build their WASH services sustainably by working arm-in-arm with governments and other great organizations. We can only do that effectively if we transparently share what we know with one another. We’re grateful for the Water Point Data Exchange and all its participants for making that sharing easier.”

Living Water International will continue to make data it collects available through WPDx on a regular basis.

If you have any questions about Living Water International, or the data they have shared, please contact Nathan Mallonee at nmallonee@water.cc

Combining Two Powerful Platforms for Unprecedented Impact: WPDx and WASHWatch

For years, WASHWatch has served as the go-to source for tracking global progress towards water, sanitation and hygiene access. This information hub serves as a key tool for civil society to  hold governments to  account, improve transparency and advocating for change. Of course, this information isn’t just for civil society. Governments can also track their progress and gain a better understanding of the challenges and opportunities within their country to inform better policy. By bringing together fragmented data in a single platform, WASHWatch has enabled users to see the full picture of WASH progress in a way that hasn’t been possible otherwise.

To date, WASHWatch has worked at global, regional and national levels, showing commitments and progress at over these levels. Through a new partnership with the Water Point Data Exchange (WPDx), WASHwatch is now presenting localized data.

Similar to WASHWatch, WPDx serves as a platform for aggregating data. However, WPDx focuses on a very small scale – individual water point information. Recognizing the many hundreds of stakeholders that carry out some form of water point mapping, WPDx serves as a global framework for sharing water point data. As of the time of this post, WPDx participants have shared information on over 300,000 water points in nearly 30 countries around the world.

This data contains a wealth of information on the water points, including location, status, water point type, payment, management, and much more. This rich body of data is being used around the world to influence policy, design programs, learn about sustainability, and much more.

By bringing these two powerful platforms together, it is possible to learn more than ever before. For the first time, users can find information about the national context and the local status of water services all in the same place. Aggregating this information allows for advocacy, learning, policy progress, and service improvements based on evidence that considers the national context while also responding to specific realities on the ground.

To access the WPDx data, check out the “WASH Sector Monitoring” tab under the country profiles. The pilot for this partnership includes water point data for 11 countries with significant data available: Afghanistan, Burkina Faso, Ethiopia, Kenya, Liberia, Malawi, Nicaragua, Sierra Leone, South Sudan, Tanzania, and Uganda.

This post was cross-posted with permission from the WASHWatch blog.
Bringing Order to the Wide Open Fields

As many WPDx users have noted, the WPDx standard includes several open text fields, including #water_tech, #water_source, and #status. Unlike fields that require a choice from a list of values or a specific number format, users can provide any text in these fields to describe a type of water point and its status.

While open text has challenges, making these fields open text allows WPDx to share an incredible amount of useful and rich information. If we required certain terms, any organization that wasn’t ready to use those terms (or didn’t in the past) would be limited in what data they could share. As a result, we would all miss out on great data just because they weren’t using a certain set of terms. Further, using generic terms (i.e. hand pump) could hide rich information such as the type of hand pump. If you wanted to compare Afridev pumps against India Mark II pumps, that information might be hidden by a generic term like “hand pump”. For these reasons, these open text fields are valuable to WPDx. However, they also pose challenges.

A New Tool:

The main challenge of these open text fields is that the values can be difficult to categorize. With thousands of unique values for each of these fields, it can be difficult to compare one type of water point with another, or see how common a certain problem might be. To address this challenge, WPDx is rolling out a new categorization tool, developed in partnership with HP Enterprises.

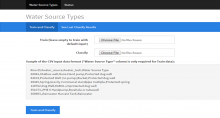
This tool allows you to define your own categories and apply them to the WPDx dataset. You will “train” the tool by uploading a dataset with some sample WPDx values and the corresponding categories you want those values to fit into. You can then apply this training document to the entire dataset. The tool is smart enough to make educated guesses on slight variations, whether that be misspellings or different ways of capturing the same information.

With this tool, users can benefit from the rich and inclusive nature of the open text fields while also easily being able to categorize data to meet their needs. 

Moving Forward:

While this tool helps users organize the diversity of data that currently exists, it would be even more efficient to begin standardizing the actual data in the future. With WPDx’s new process for updating the standard, there is now an opportunity for interested organizations to propose recommended vocabularies or other approaches to help standardize open text fields moving forward. Click here to learn how you can propose changes to the standard and help improve the way that water point data is standardized.

How To Use the Tool:

  1. You can use the template here to define your own categories for #water_source and #water_tech, or here to create categories for #status.
  2. Visit Categories.WaterPointData.org to access the new tool.
  3. Select “Water Source Types” or “Status” from the top black menu depending on what you want to categorize.
  4. Upload your training document in the top box.
  5. Visit data.waterpointdata.org and download the data you want to categorize.
  6. Leave only the #row_id and the data to categorize:
    • #water_source and #water_tech; or
    • #status
  7. Click “Train and Classify”

If you have any questions or feedback, contact us at info@waterpointdata.org

Credits:

Thank you to HP Enterprise and the Top Coder community for support in developing the tool and Joe Cook and Sheena Lahren for providing outstanding sample data for exploring the status categorization.